Home / Public work
Public folder
Public work
Everything on this site that is public, in one place: 15 items across 6 projects. Every item carries its as-of date. Prices and levels are a record of the analysis on that date, not live calls.
| Item | Analyst | As of | Format |
|---|---|---|---|
| NVIDIA (NASDAQ: NVDA): initiation report Equity research | |||
| NVDA Investor Report (full PDF, 34 pages)The complete initiation: summary, valuation, technicals, risk, sizing, appendices and disclosures. | Graham · Wick · Screener · Ledger | As of October 7, 2026 close | PDF · 2.0 MB |
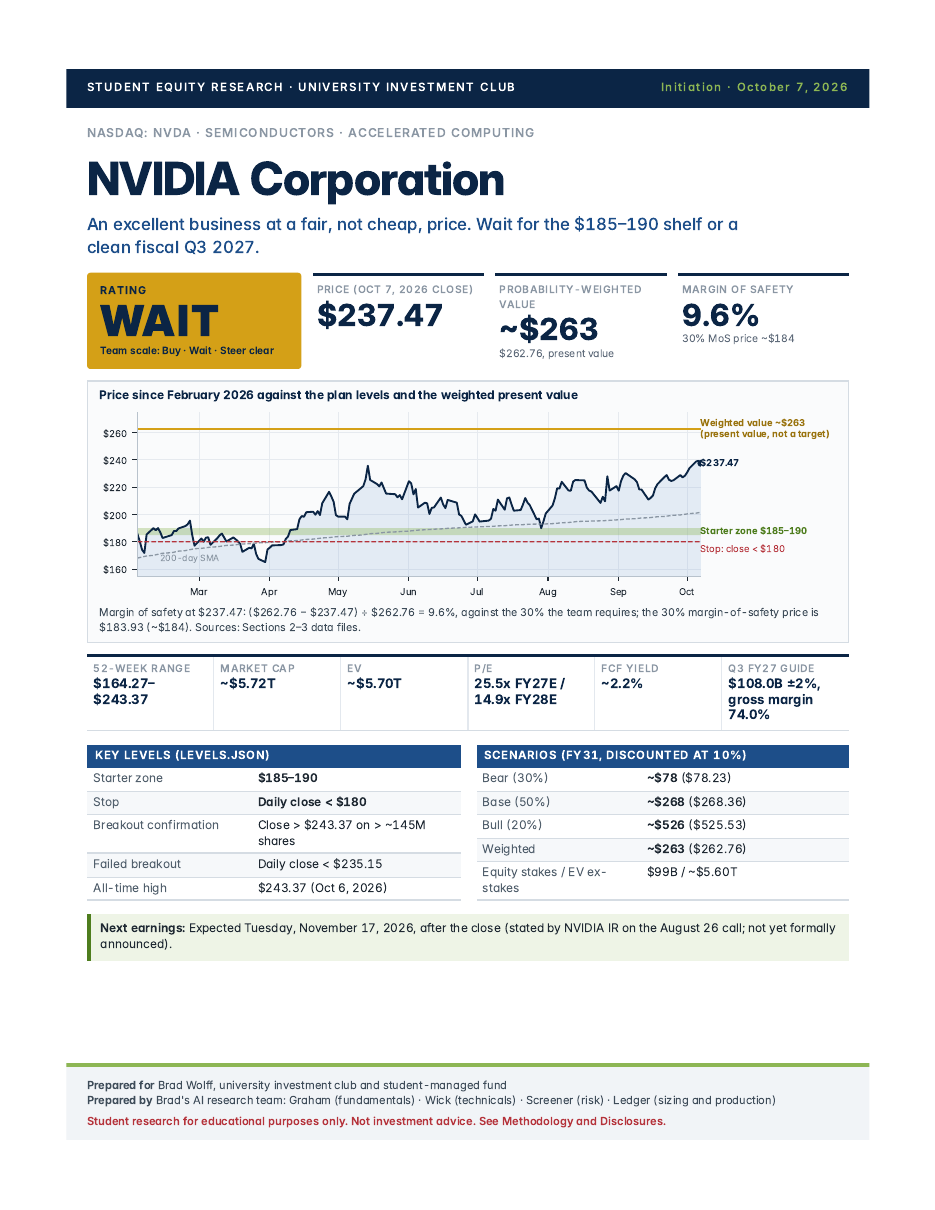
| Report coverPage 1: the WAIT rating, $237.47 price against a ~$263 probability-weighted value, and the key levels. | Ledger | As of October 7, 2026 close | Image · 935×1210 |
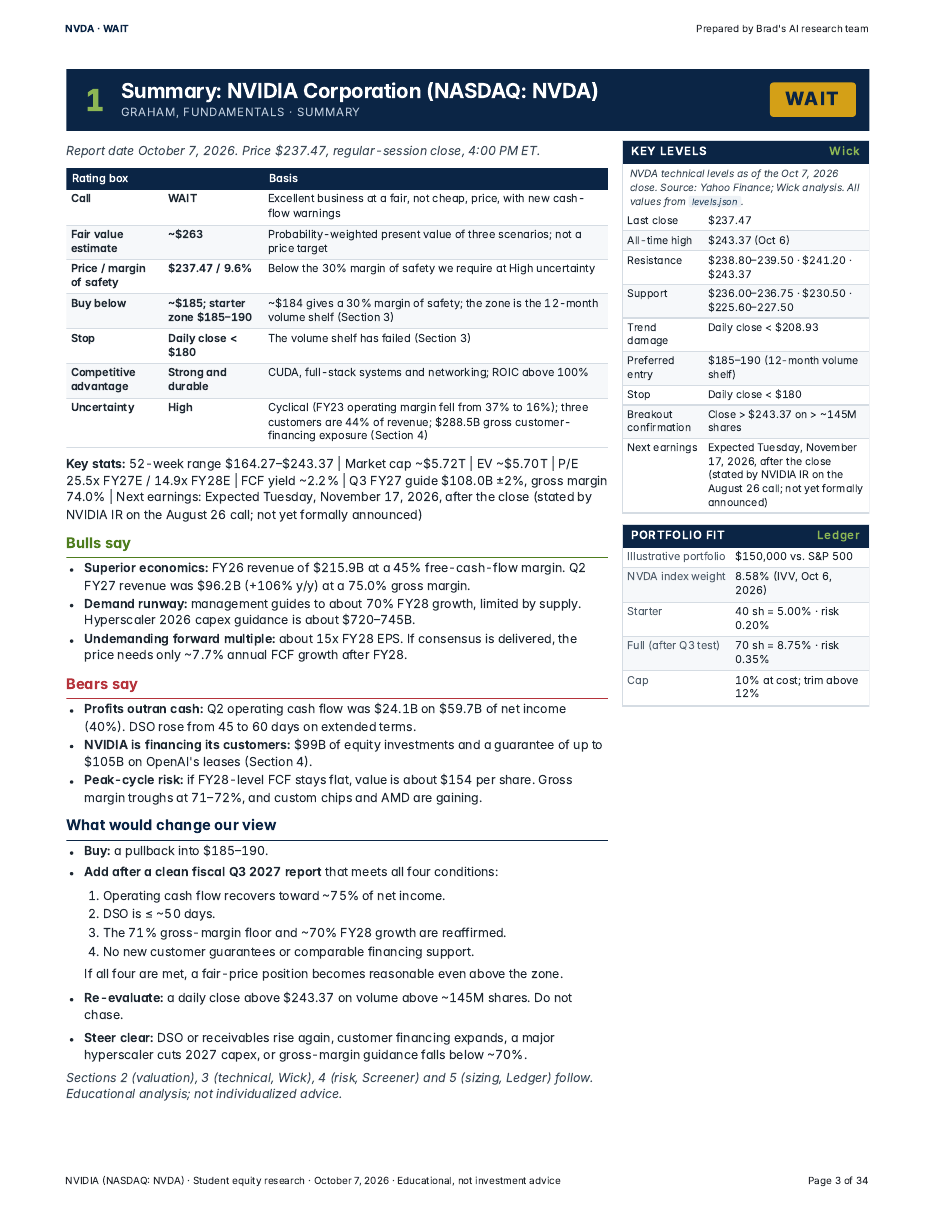
| One-page summaryThe whole call on one page: rating box, Bulls say / Bears say, and what would change the view. | Graham | As of October 7, 2026 close | Image · 935×1210 |
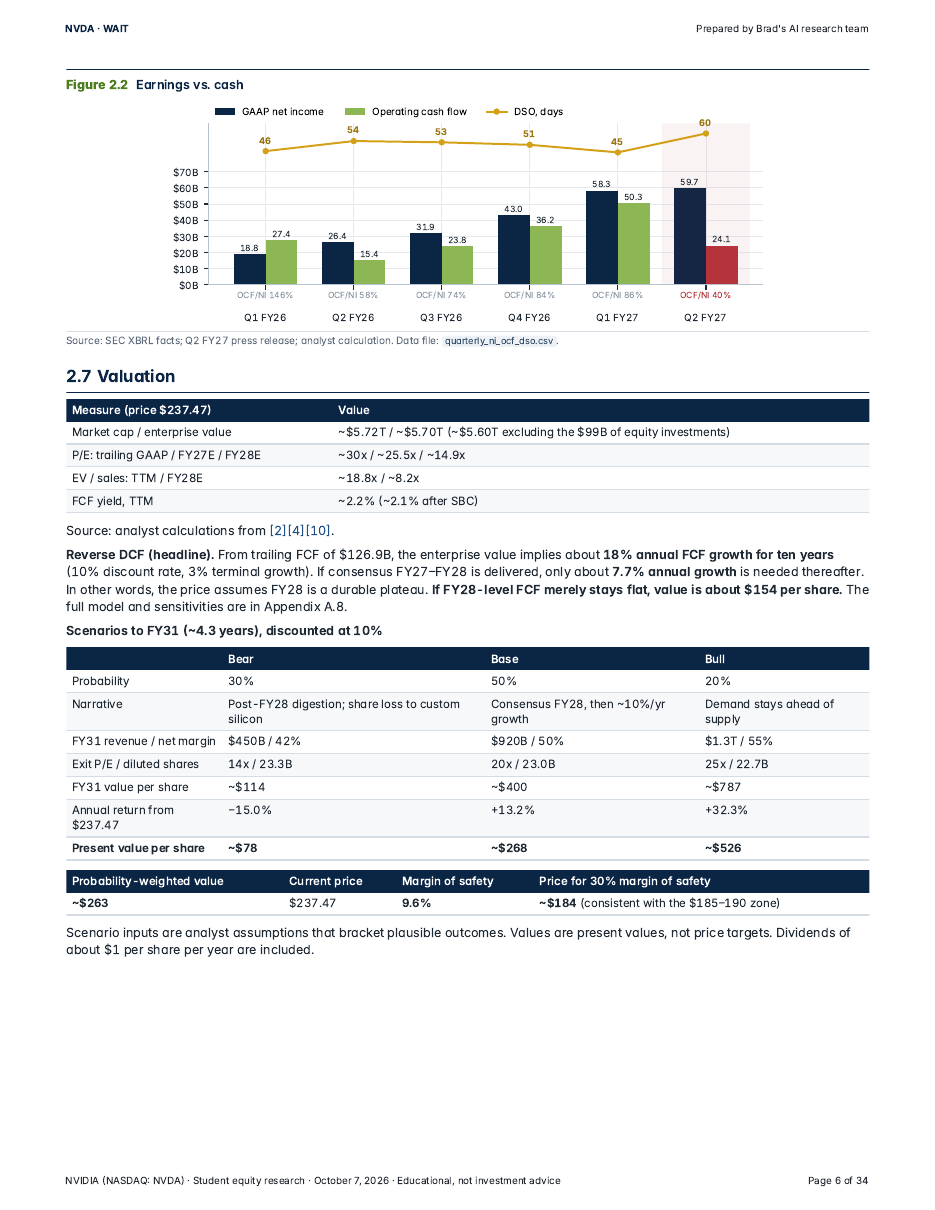
| Valuation: earnings vs. cashNet income vs. operating cash flow, and the bear / base / bull scenarios behind the margin-of-safety math. | Graham | As of October 7, 2026 close | Image · 935×1210 |
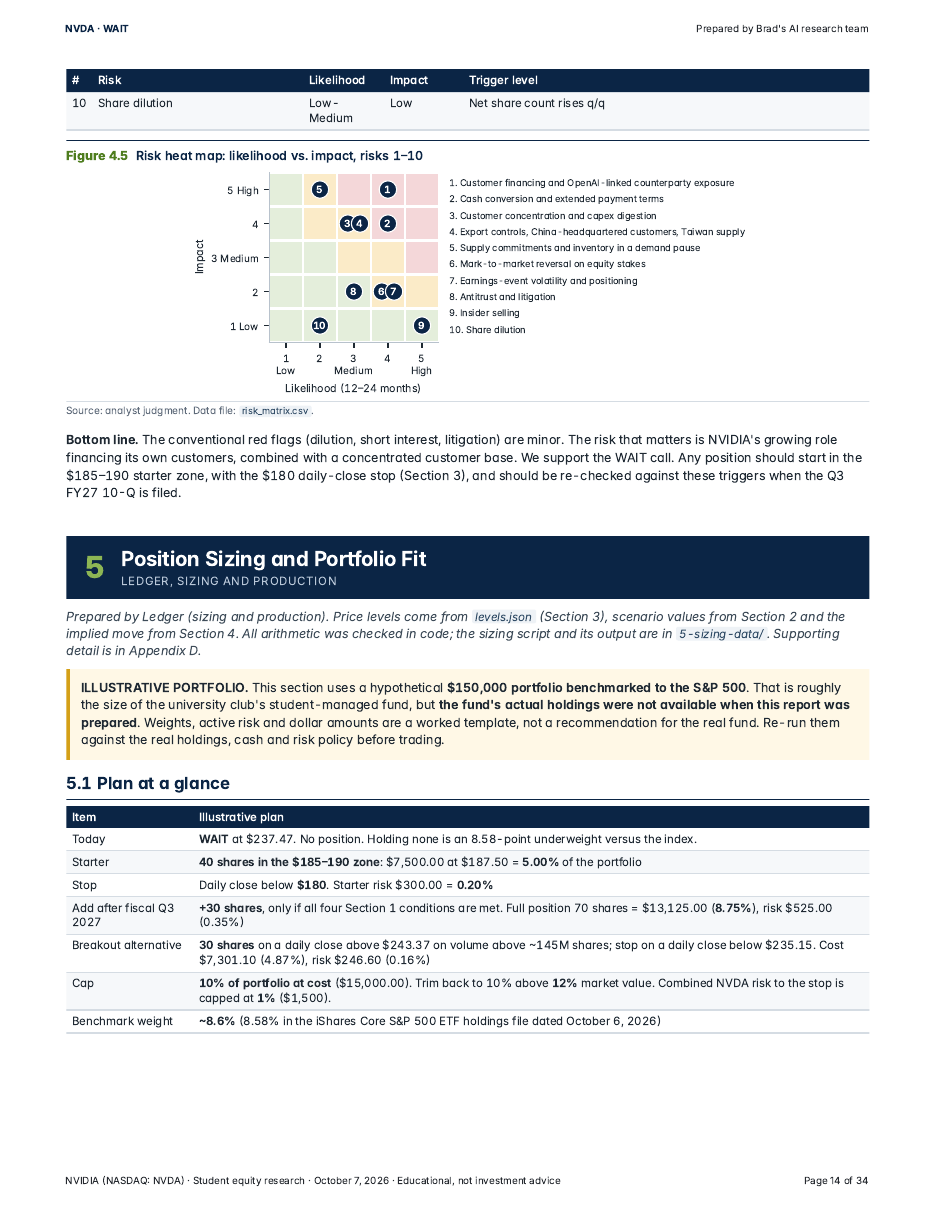
| Position sizing (illustrative portfolio)Risk heat map and a sizing plan for a hypothetical $150K portfolio benchmarked to the S&P 500. | Ledger | As of October 7, 2026 close | Image · 935×1210 |
| NVDA technical study: anchored VWAP and volume profile Technical analysis | |||
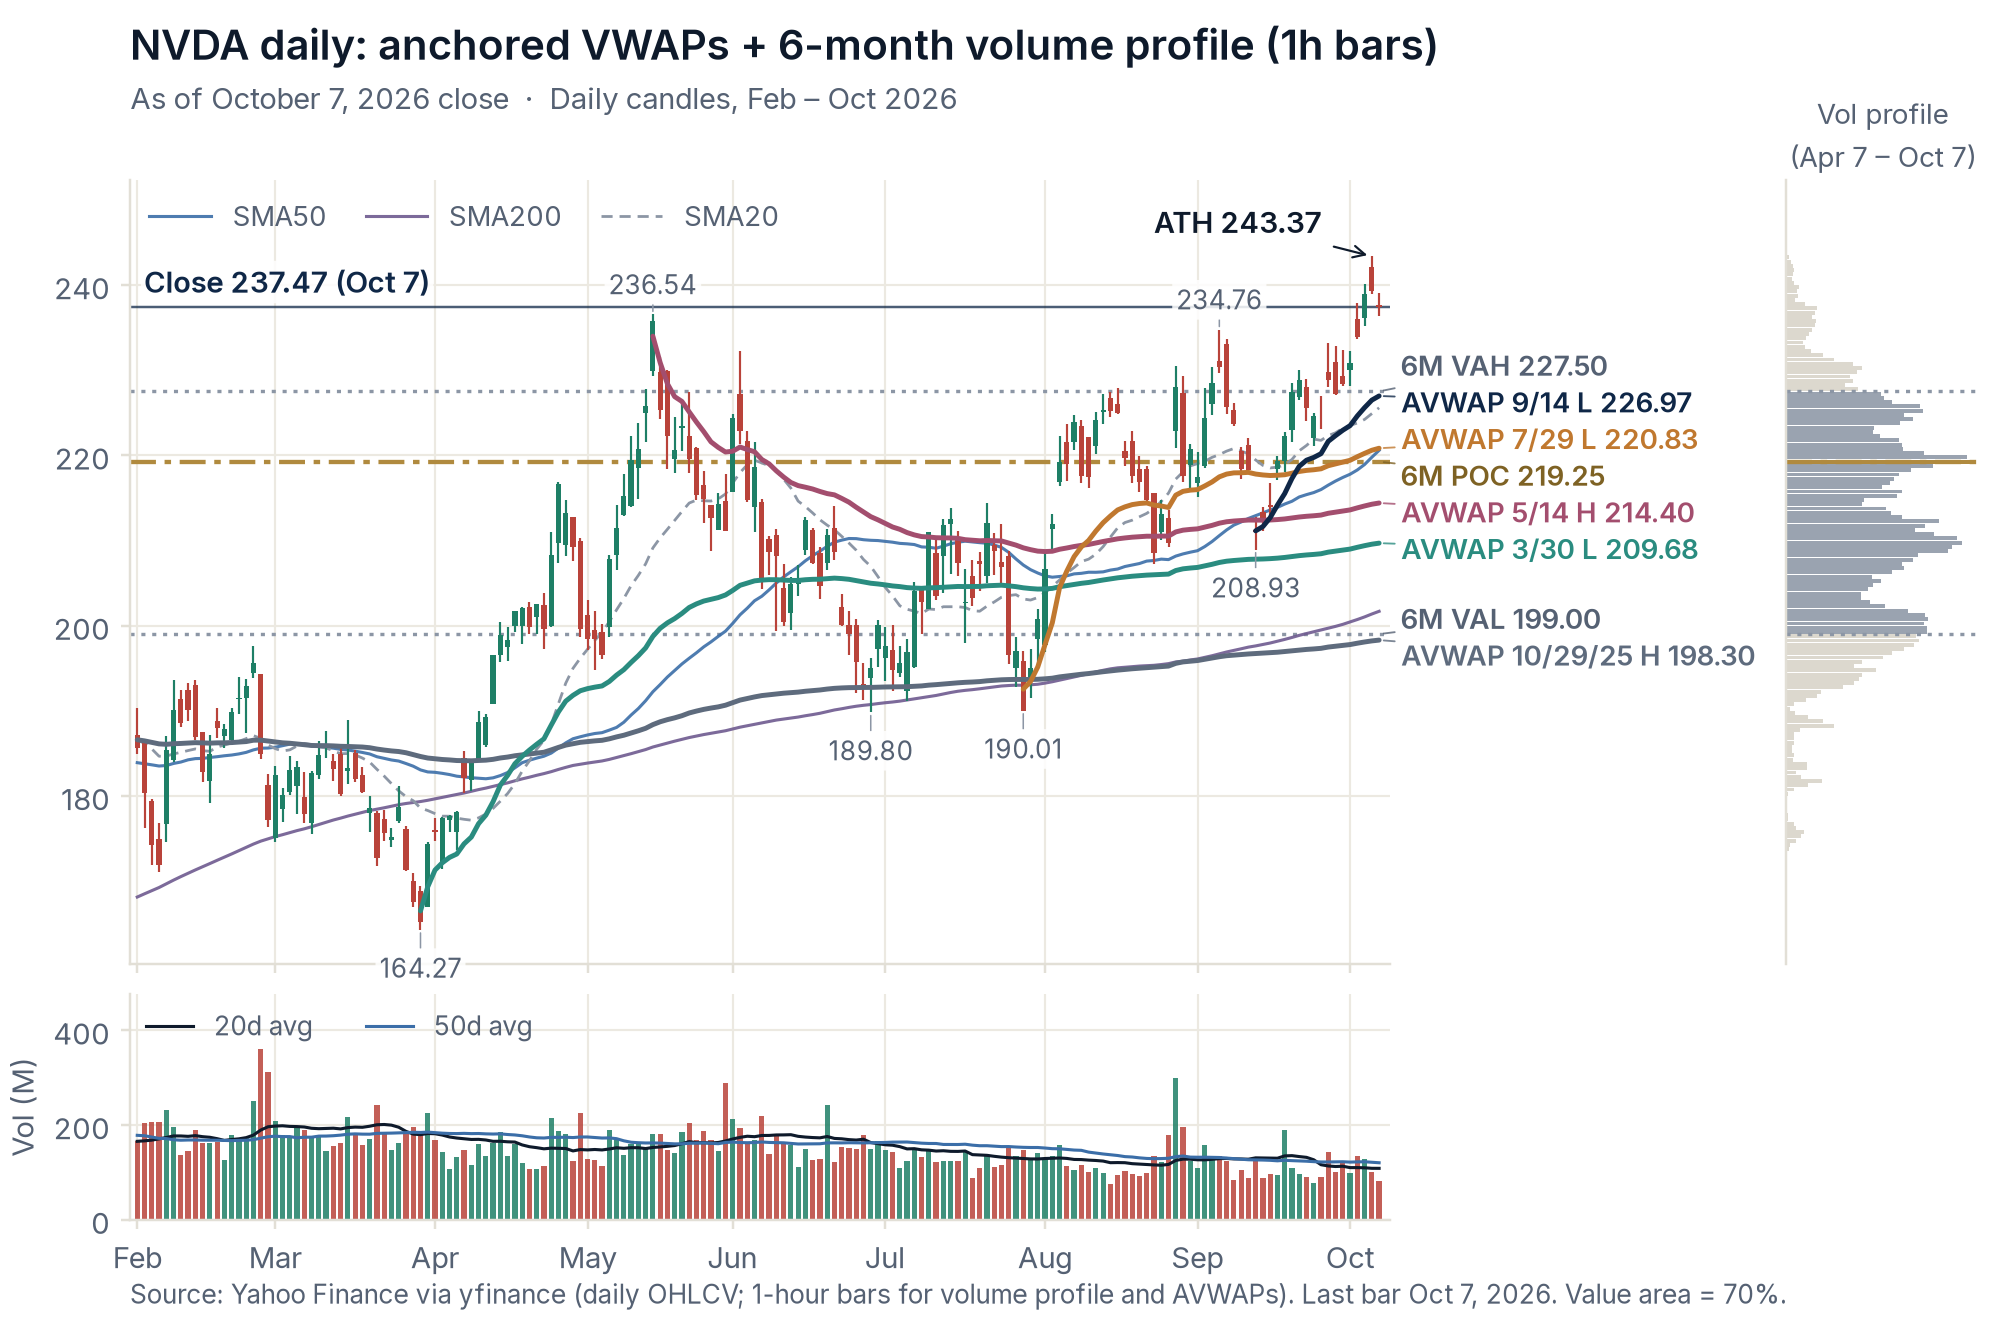
| NVDA daily: anchored VWAPs + volume profileDaily chart with moving averages, swing-anchored VWAPs and the six-month volume profile (value area and point of control). | Wick | As of October 7, 2026 close | Image · 2000×1333 |
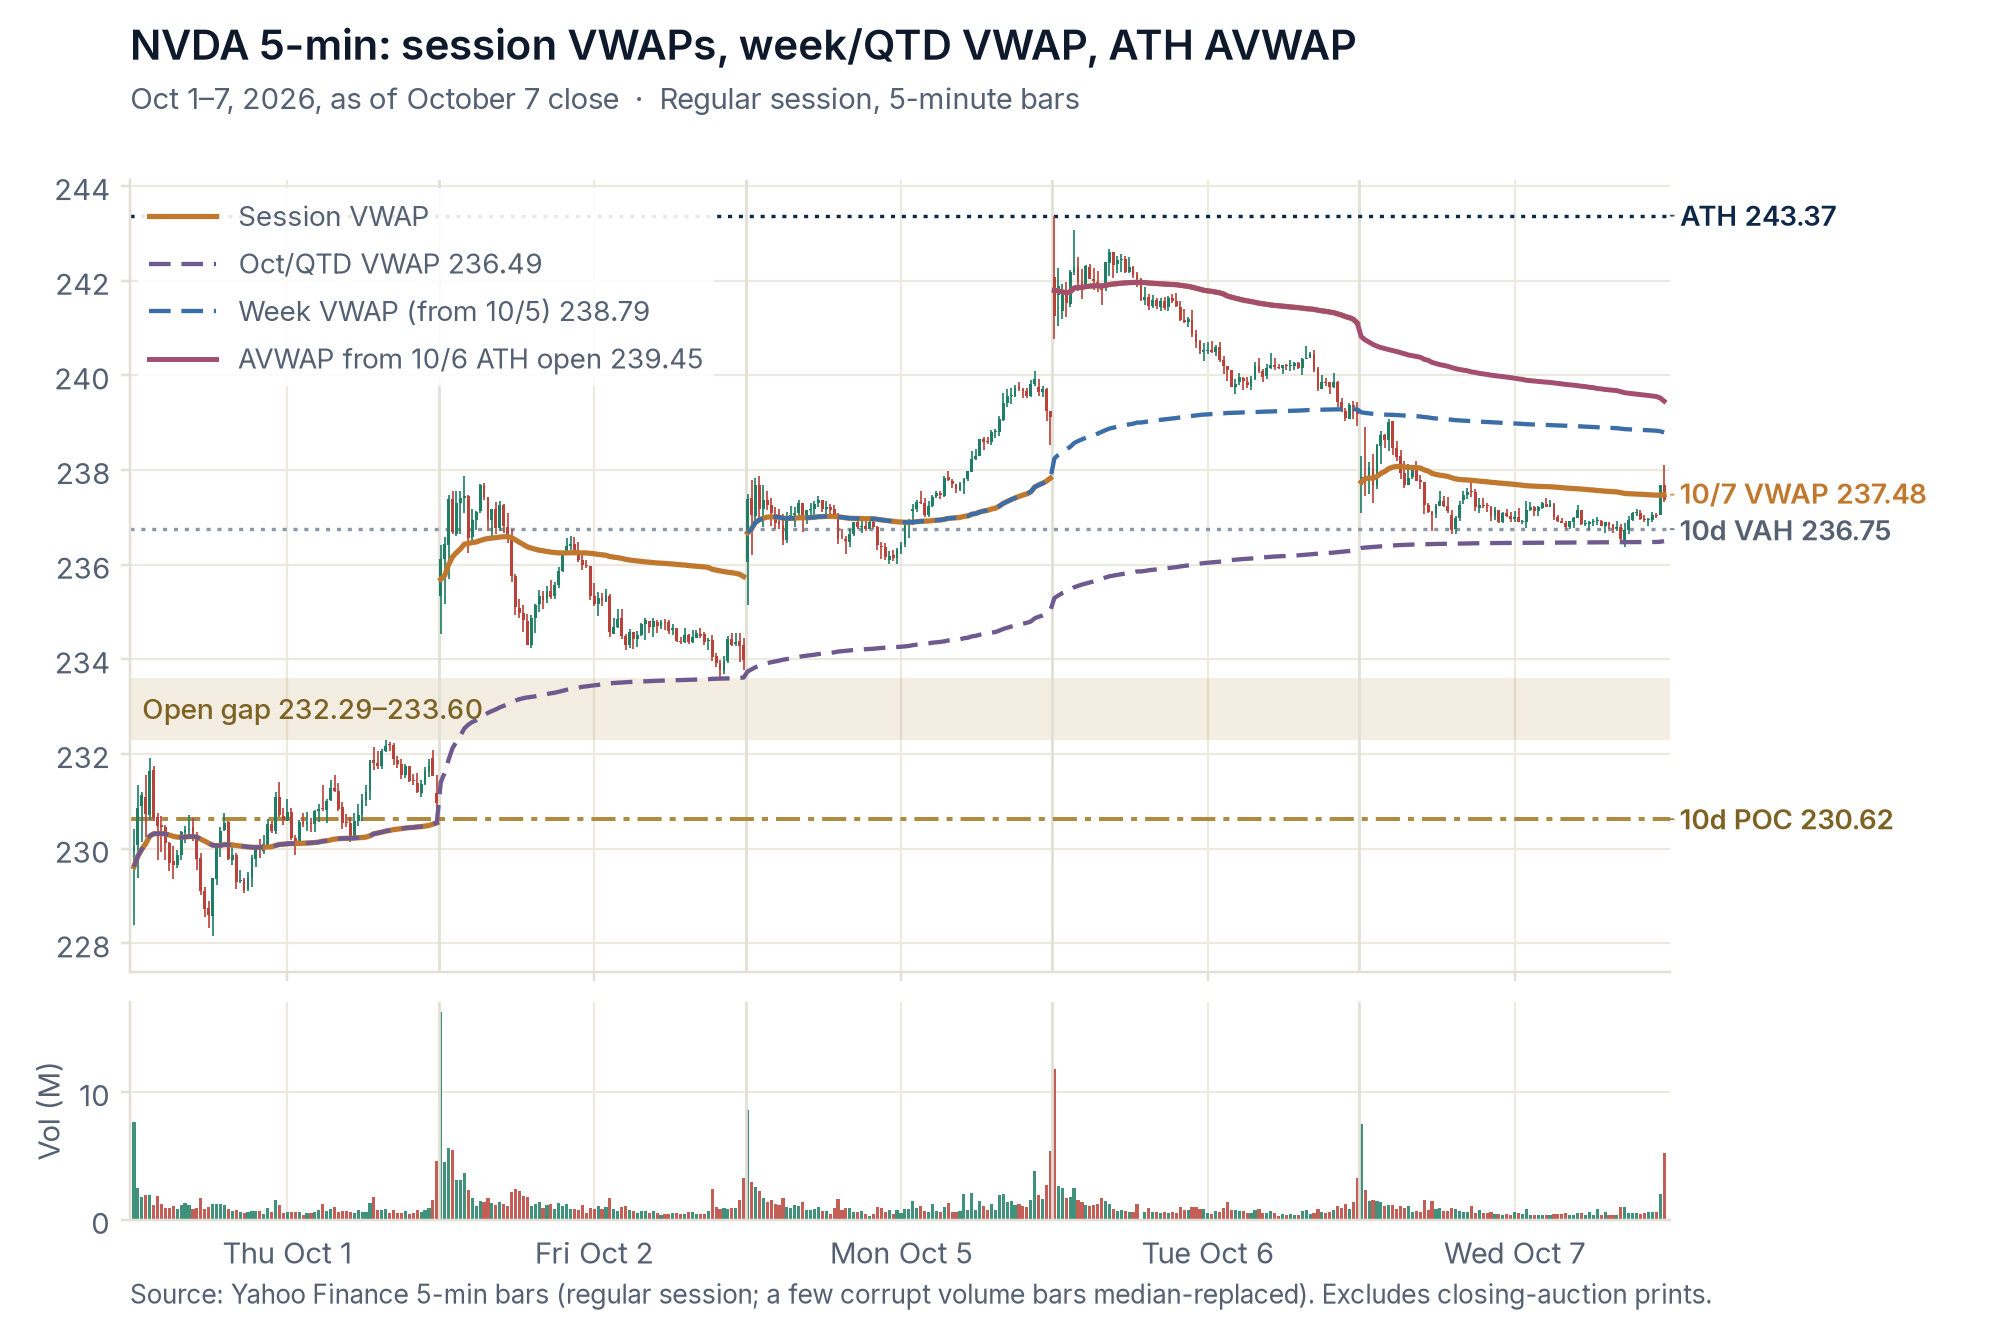
| NVDA intraday (5-minute), Oct 1-7Session, weekly and quarter-to-date VWAPs, the VWAP anchored at the all-time high, and the open gap. | Wick | As of October 7, 2026 close | Image · 2000×1333 |
| Short screener: methodology Forensic screening | |||
| Methodology write-up | Screener | Methodology as of October 2026 | Web page |
| How we invest Process | |||
| How we invest (essay) | Graham | Worked example as of October 7, 2026 close | Web page |
| Trading journal dashboard (demo data) Tooling | |||
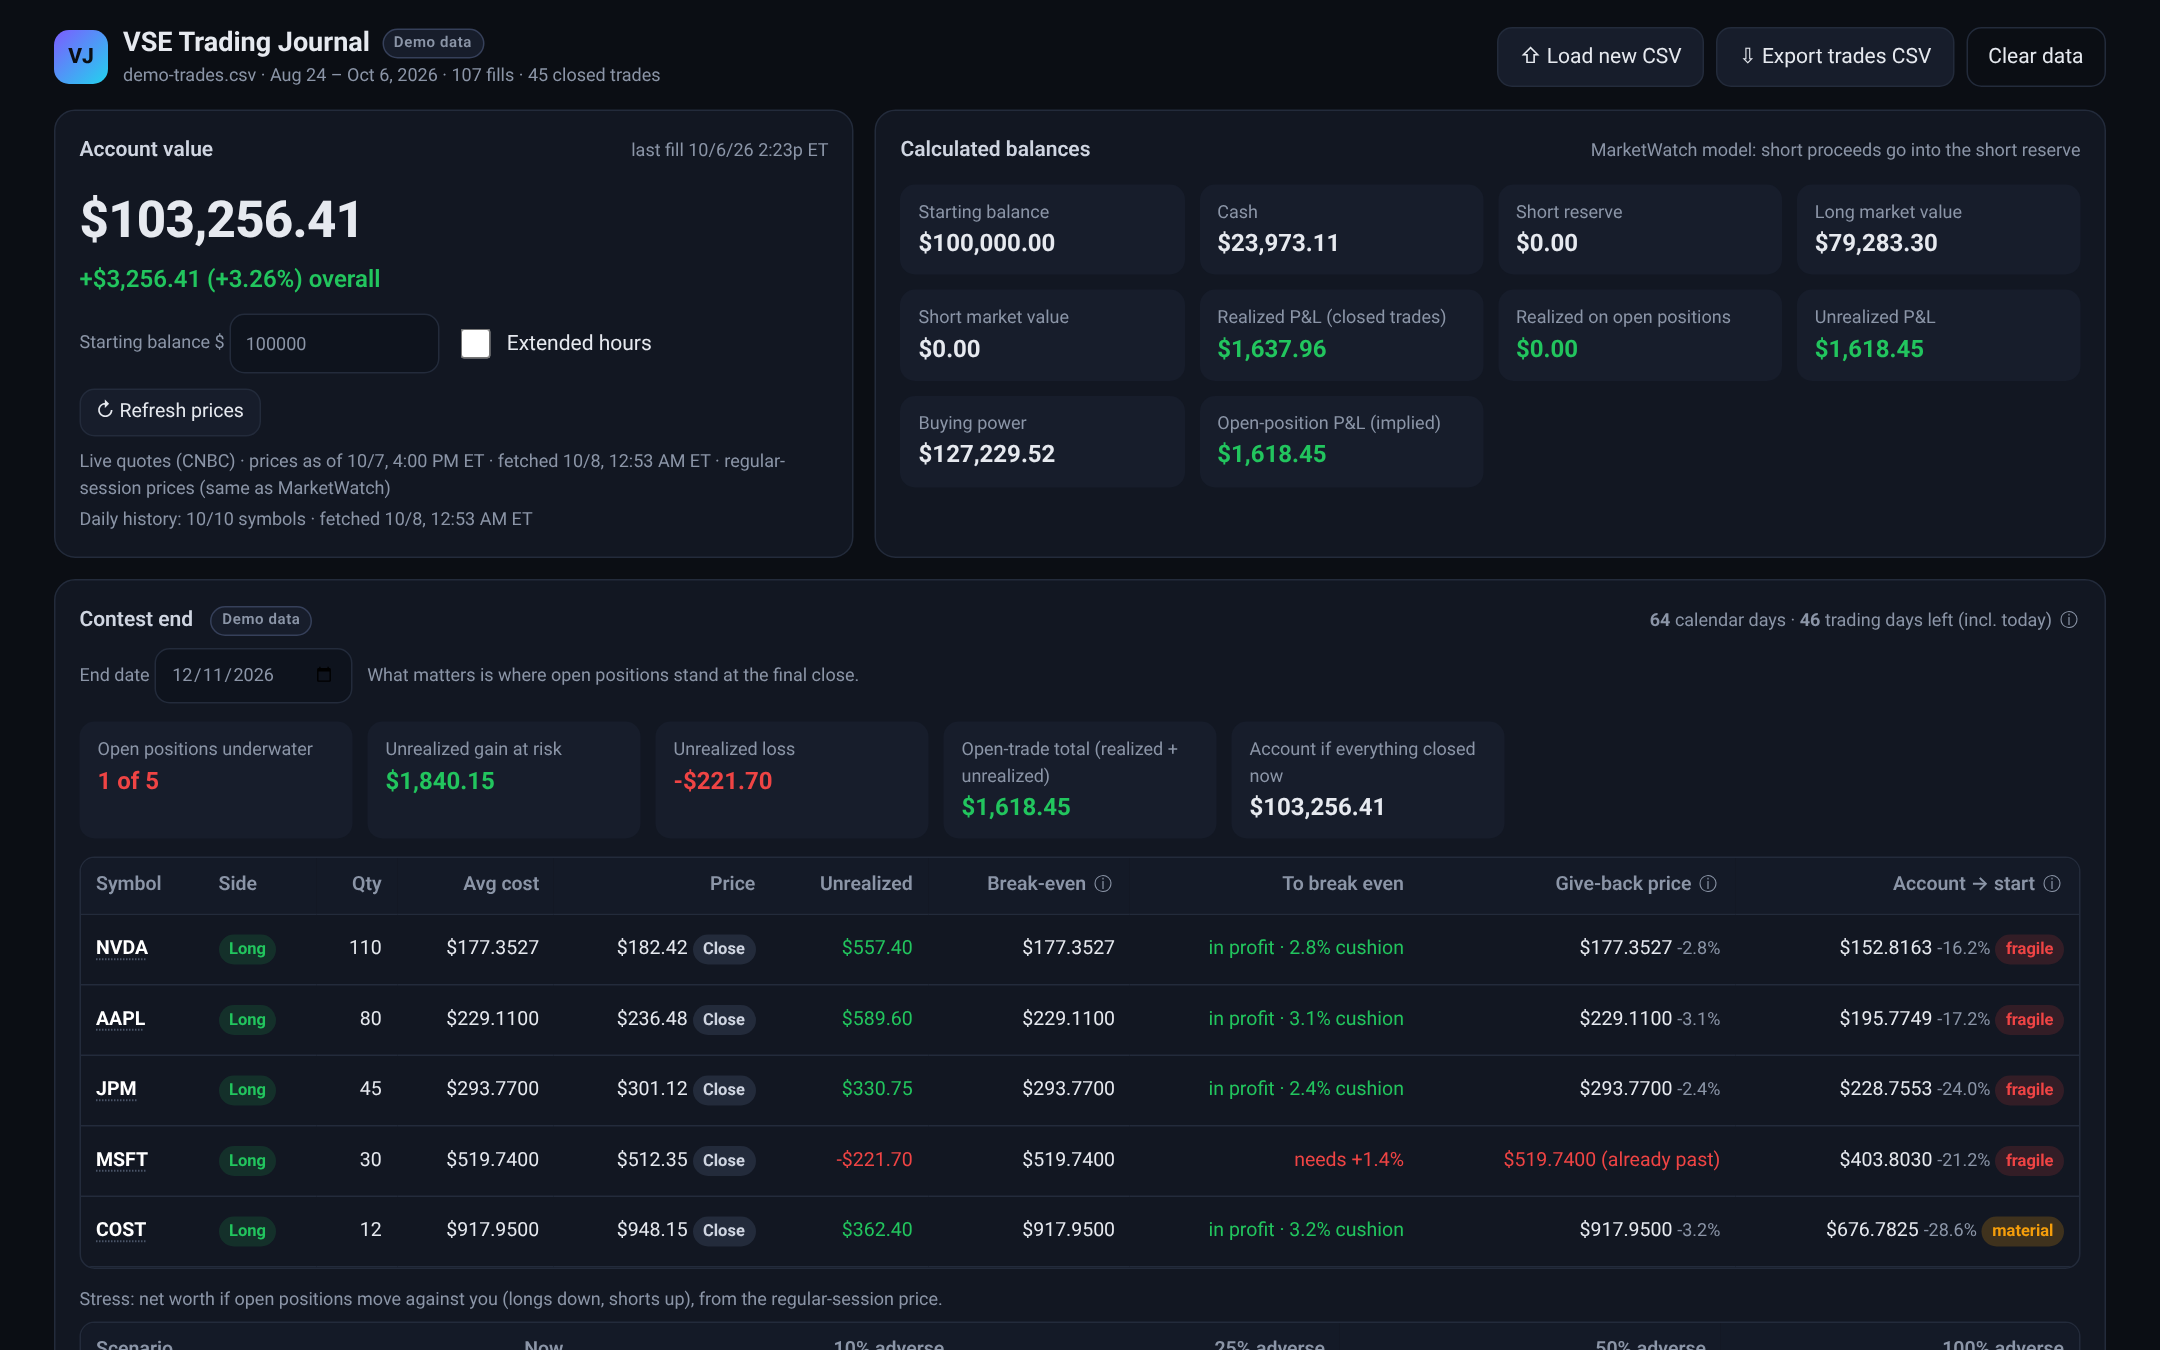
| Dashboard overviewAccount value, calculated balances and the contest-end view, rebuilt from every fill. Demo account starting at $100,000; prices and figures are illustrative demo data. | Ledger | Illustrative demo data | Image · 2160×1350 |
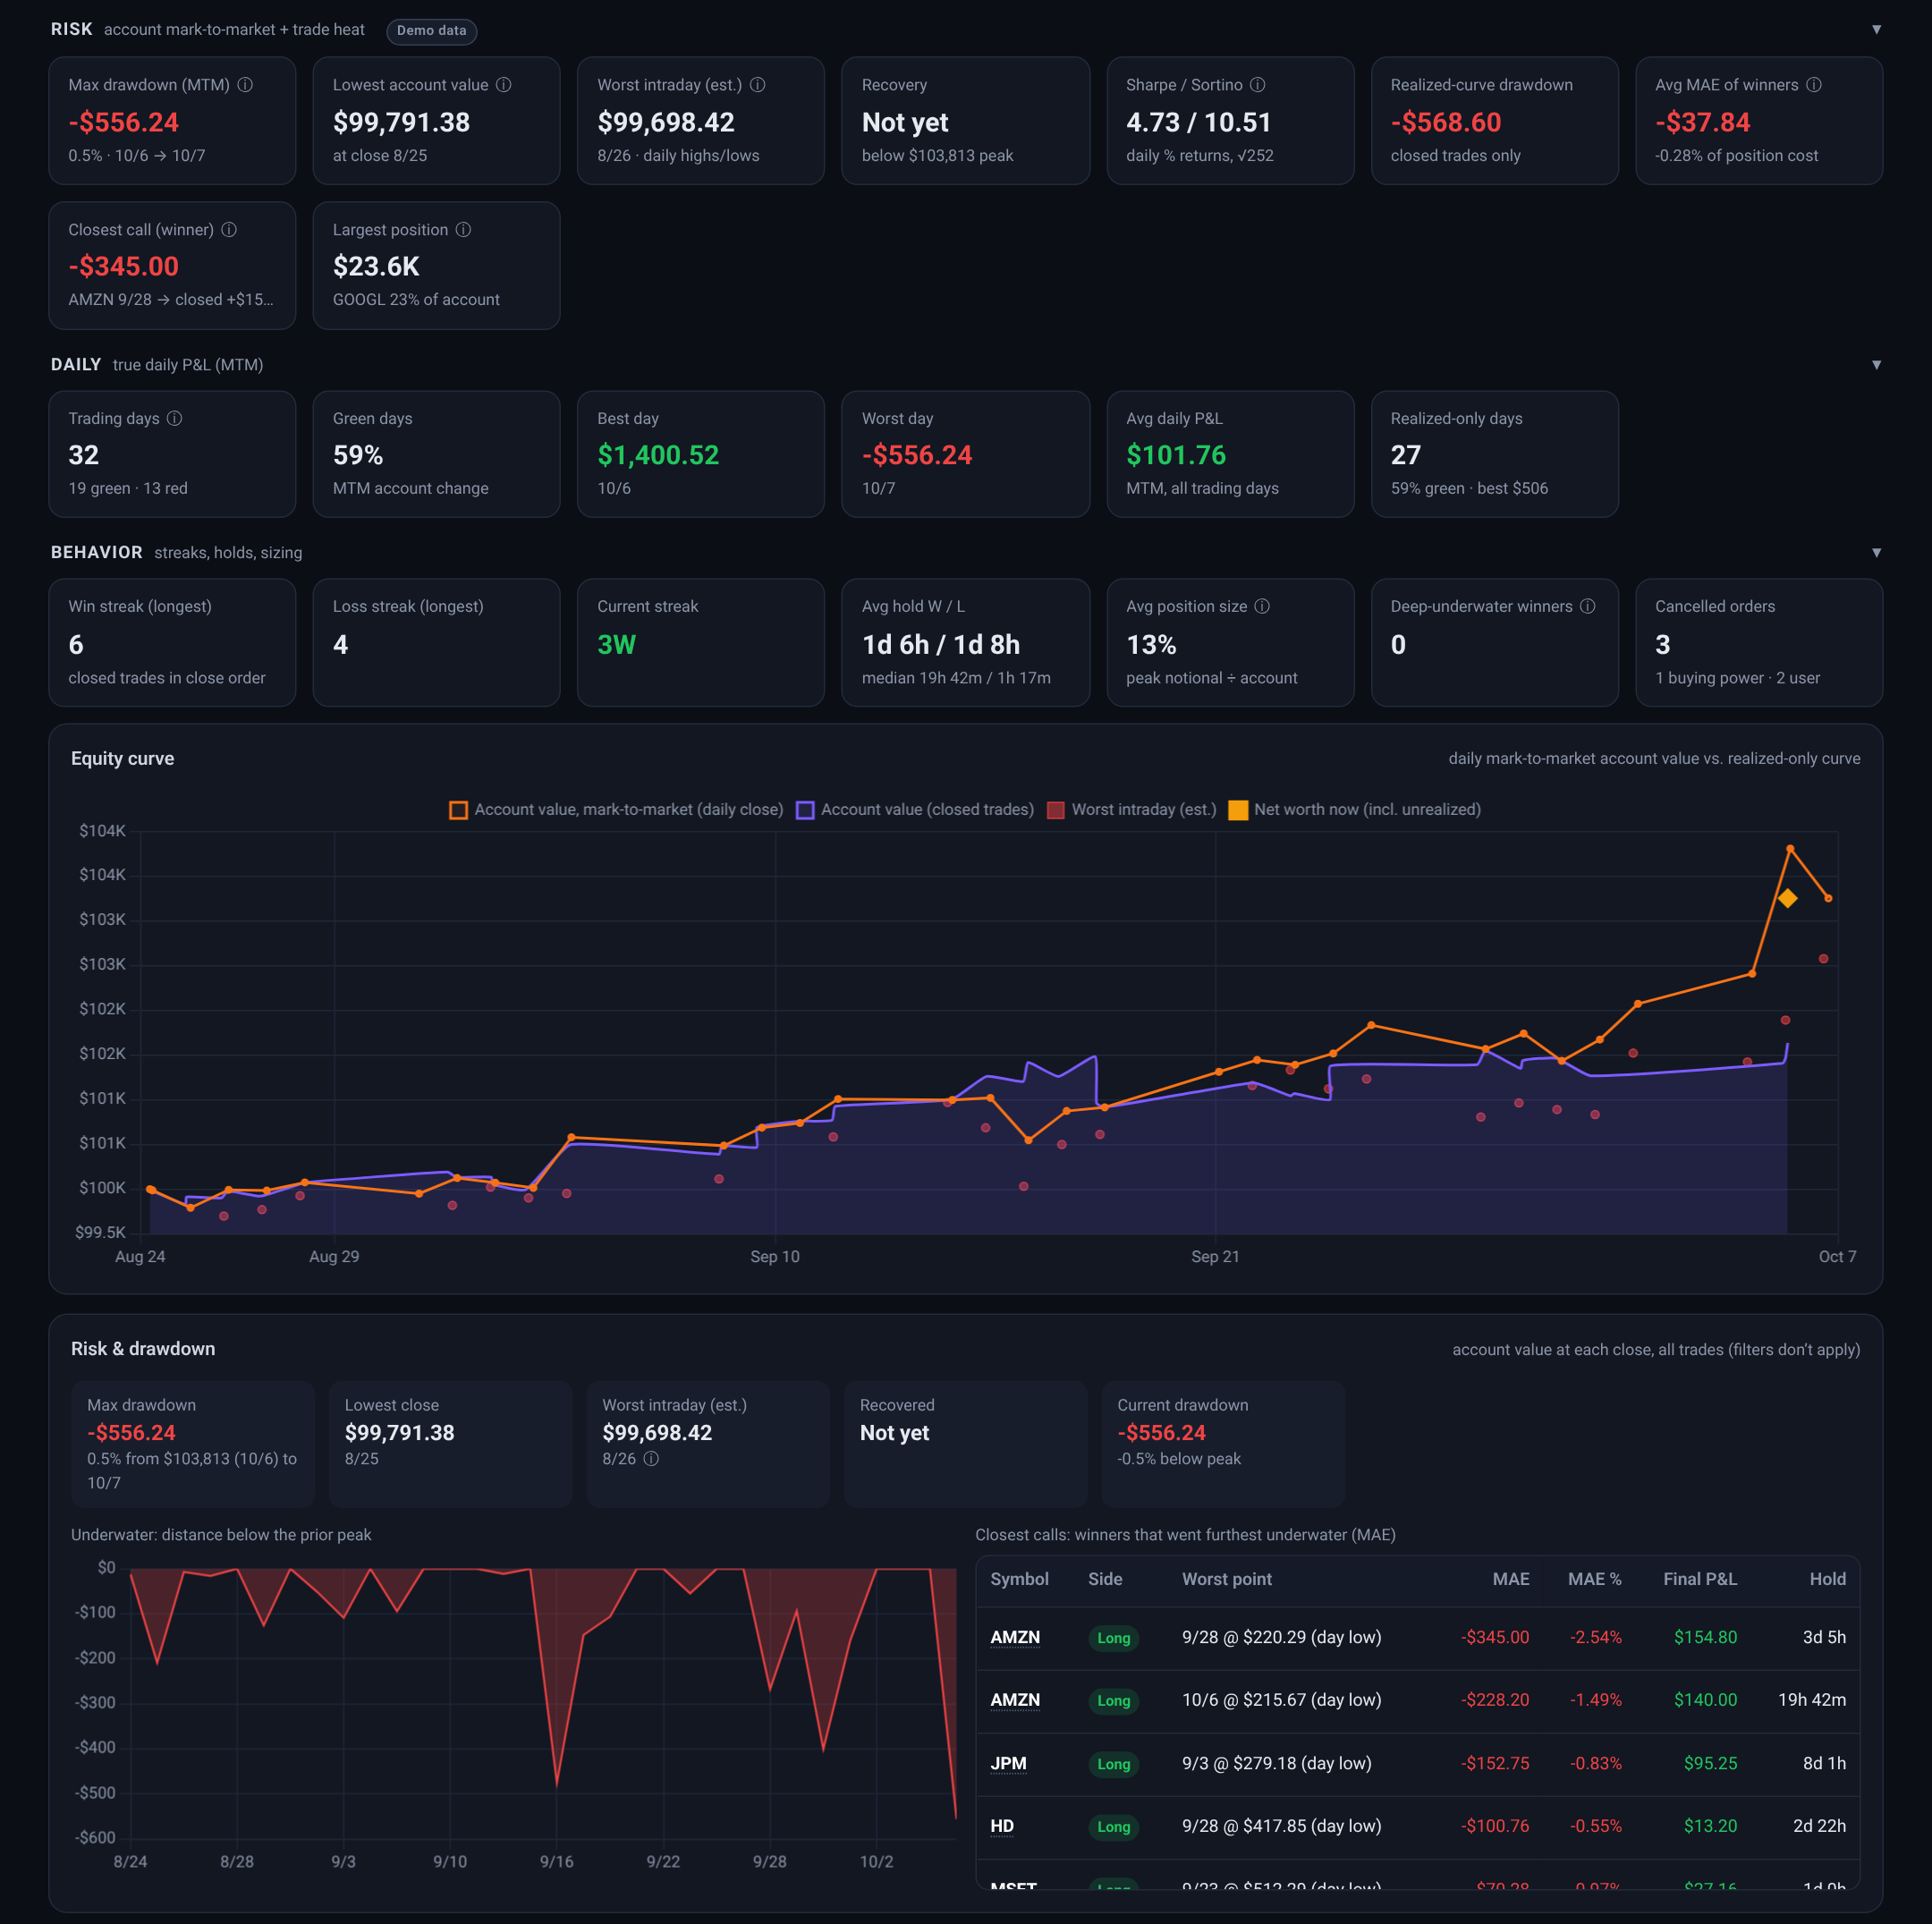
| Risk, drawdown and equity curveDrawdowns, daily P&L, streaks and the equity curve, so the process gets judged, not just the result. Demo account starting at $100,000; figures are illustrative demo data. | Ledger | Illustrative demo data | Image · 2160×2151 |
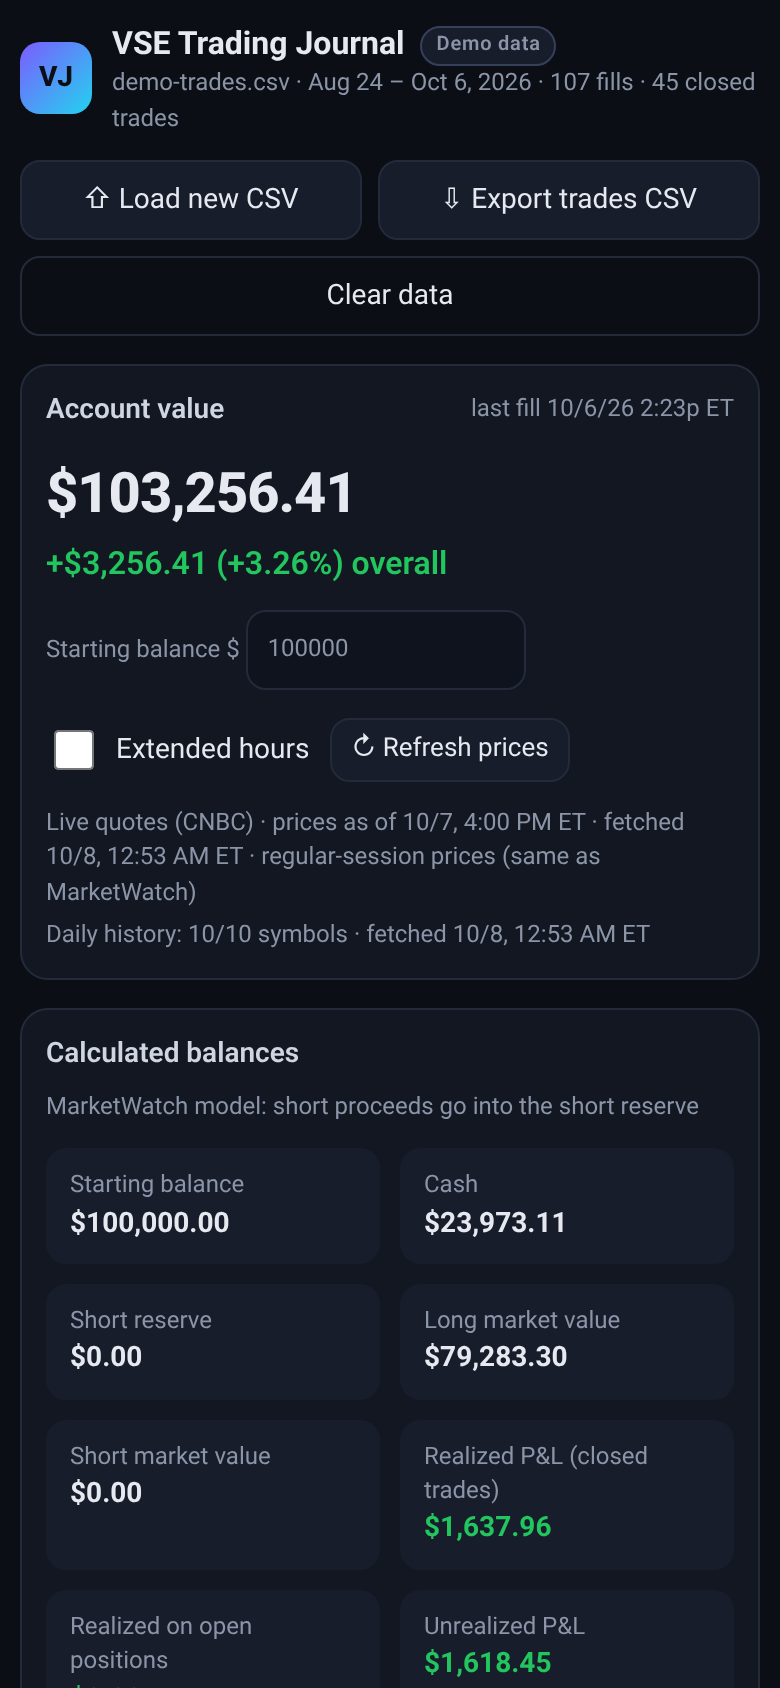
| Dashboard on a phoneThe same journal on a phone-sized screen. Demo account starting at $100,000; prices and figures are illustrative demo data. | Ledger | Illustrative demo data | Image · 780×1688 |
| Trading command center browser add-on (demo data) Tooling | |||
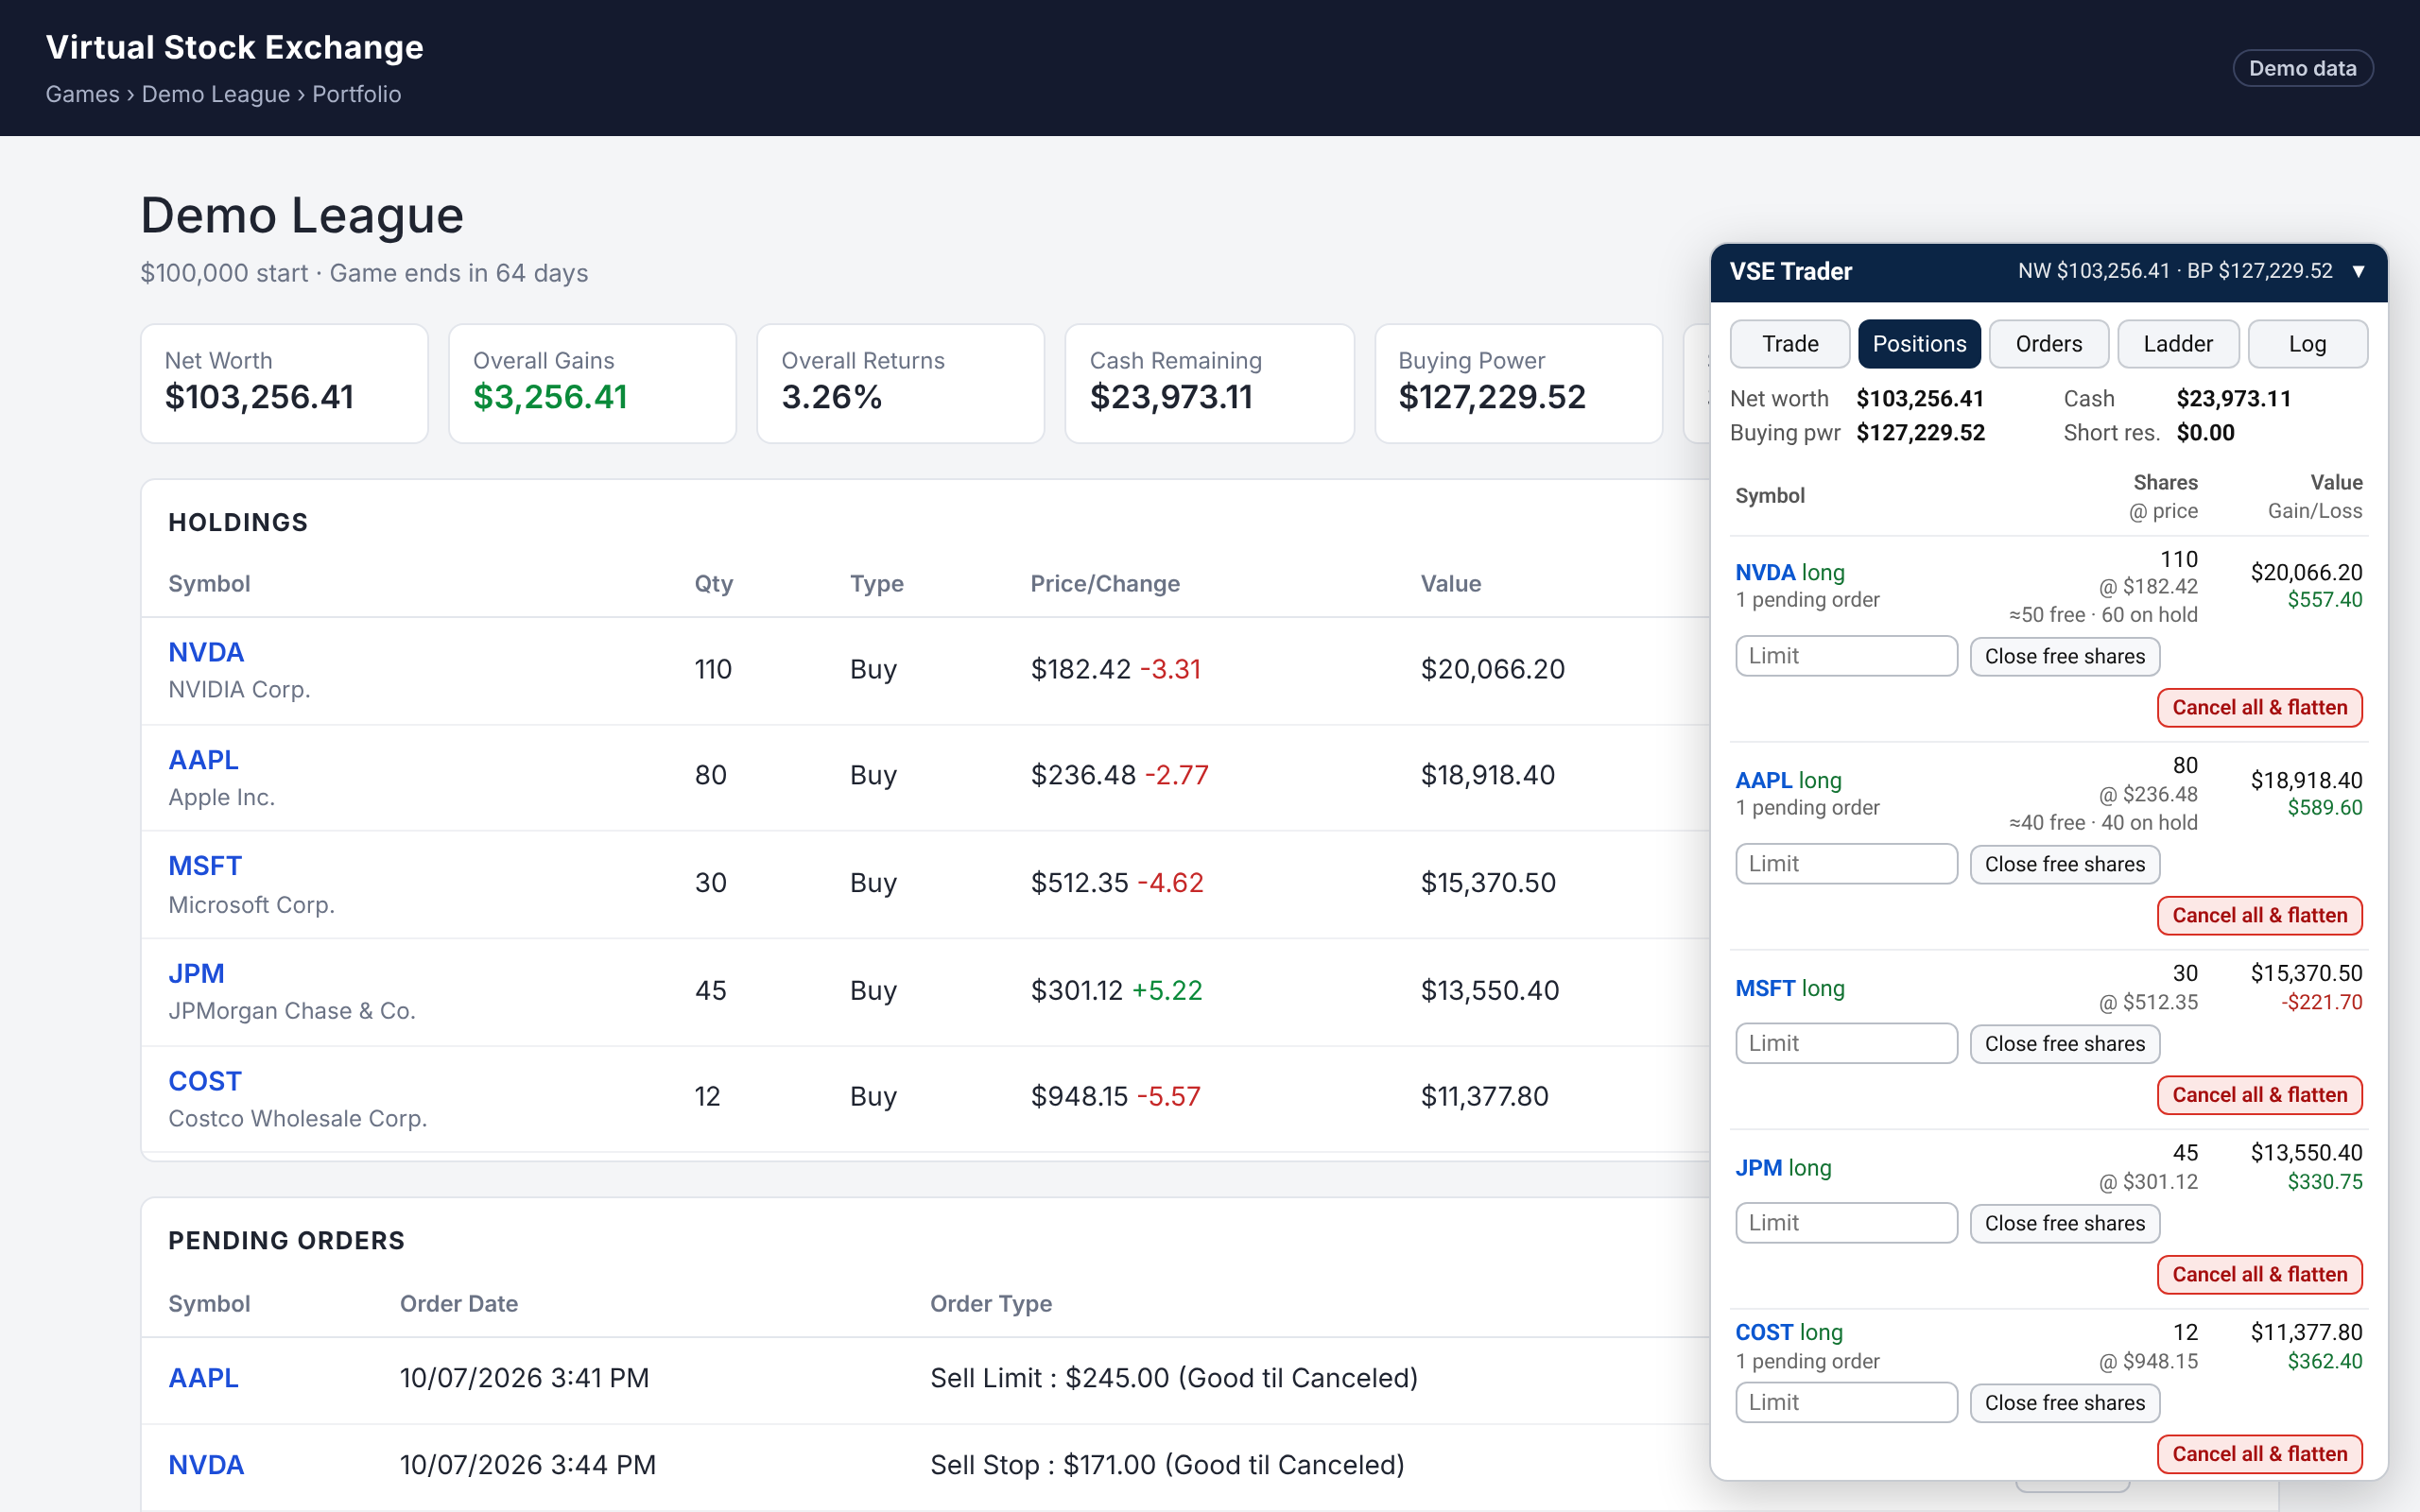
| Command center on desktopDocked beside the game's portfolio page: net worth, buying power, per-position exits and pending orders. Demo account starting at $100,000; figures are illustrative demo data. | Ledger | Illustrative demo data | Image · 2560×1600 |
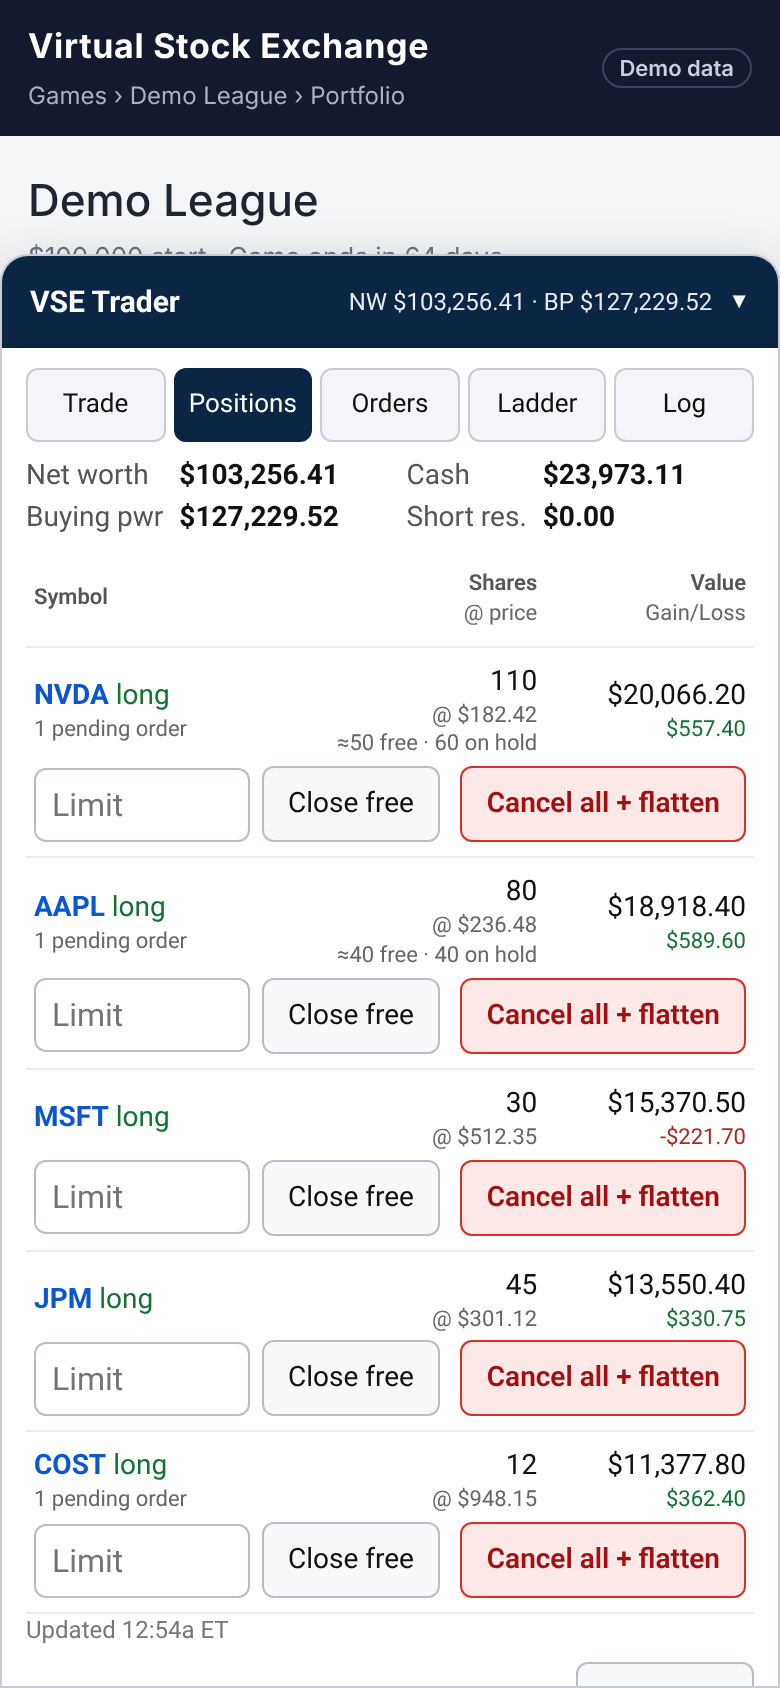
| Positions on a phoneEach position with a limit field, close-free-shares and cancel-all-and-flatten controls. Demo account starting at $100,000; figures are illustrative demo data. | Ledger | Illustrative demo data | Image · 780×1688 |
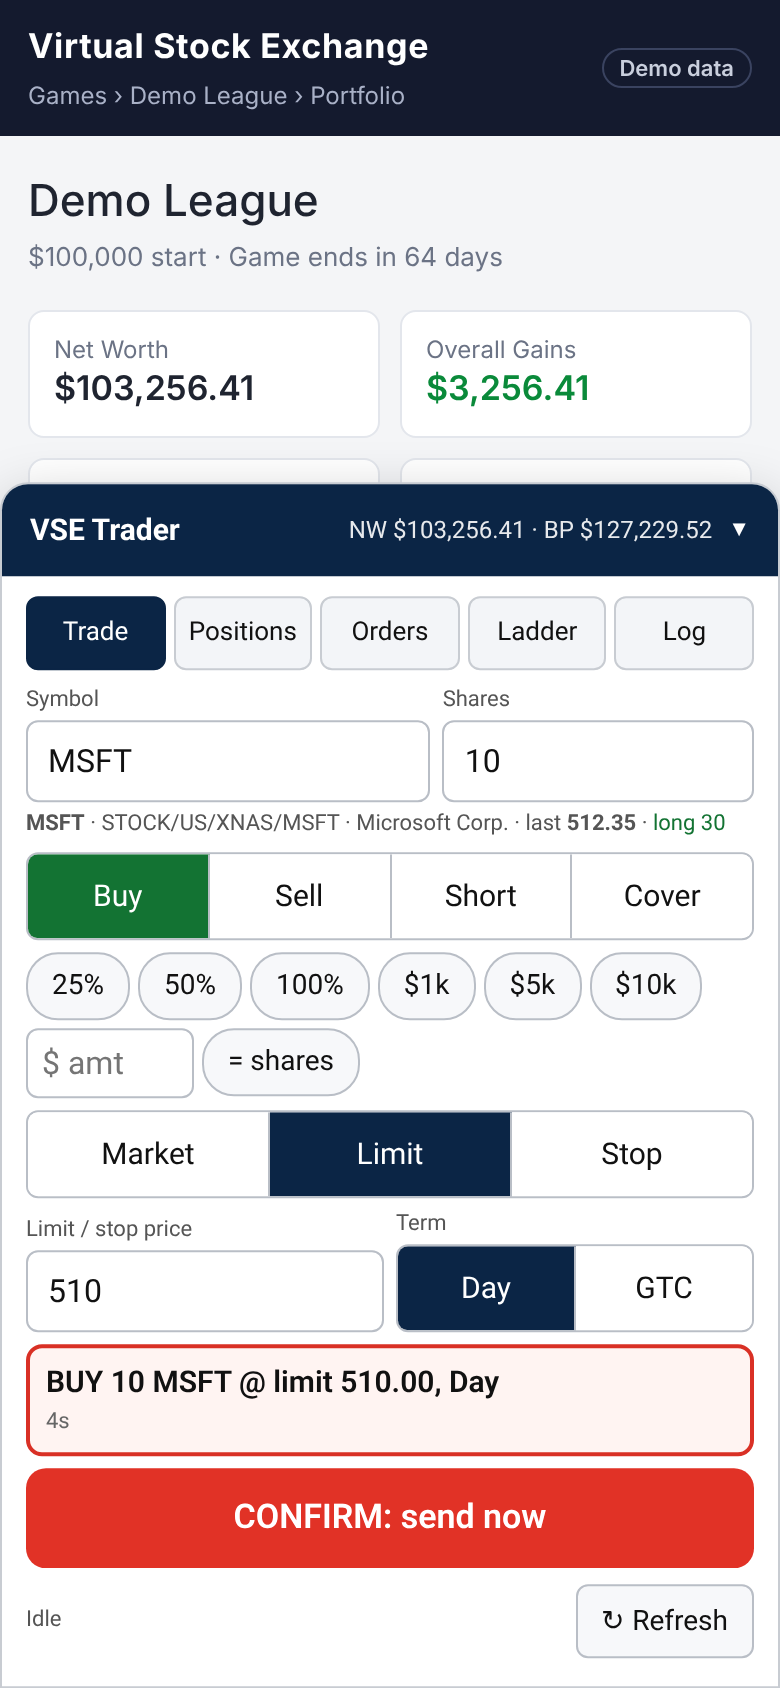
| Arm, then confirmEvery order takes two taps: arm it, then confirm within 5 seconds. Demo account starting at $100,000; figures are illustrative demo data. | Ledger | Illustrative demo data | Image · 780×1688 |