
Home / Public work / NVDA technical study: anchored VWAP and volume profile
Technical analysis
NVDA technical study: anchored VWAP and volume profile
Wick's charts behind the report's levels: daily candles with 20/50/200-day averages, VWAPs anchored at major swings, a six-month volume profile, and a 5-minute intraday view of Oct 1-7.
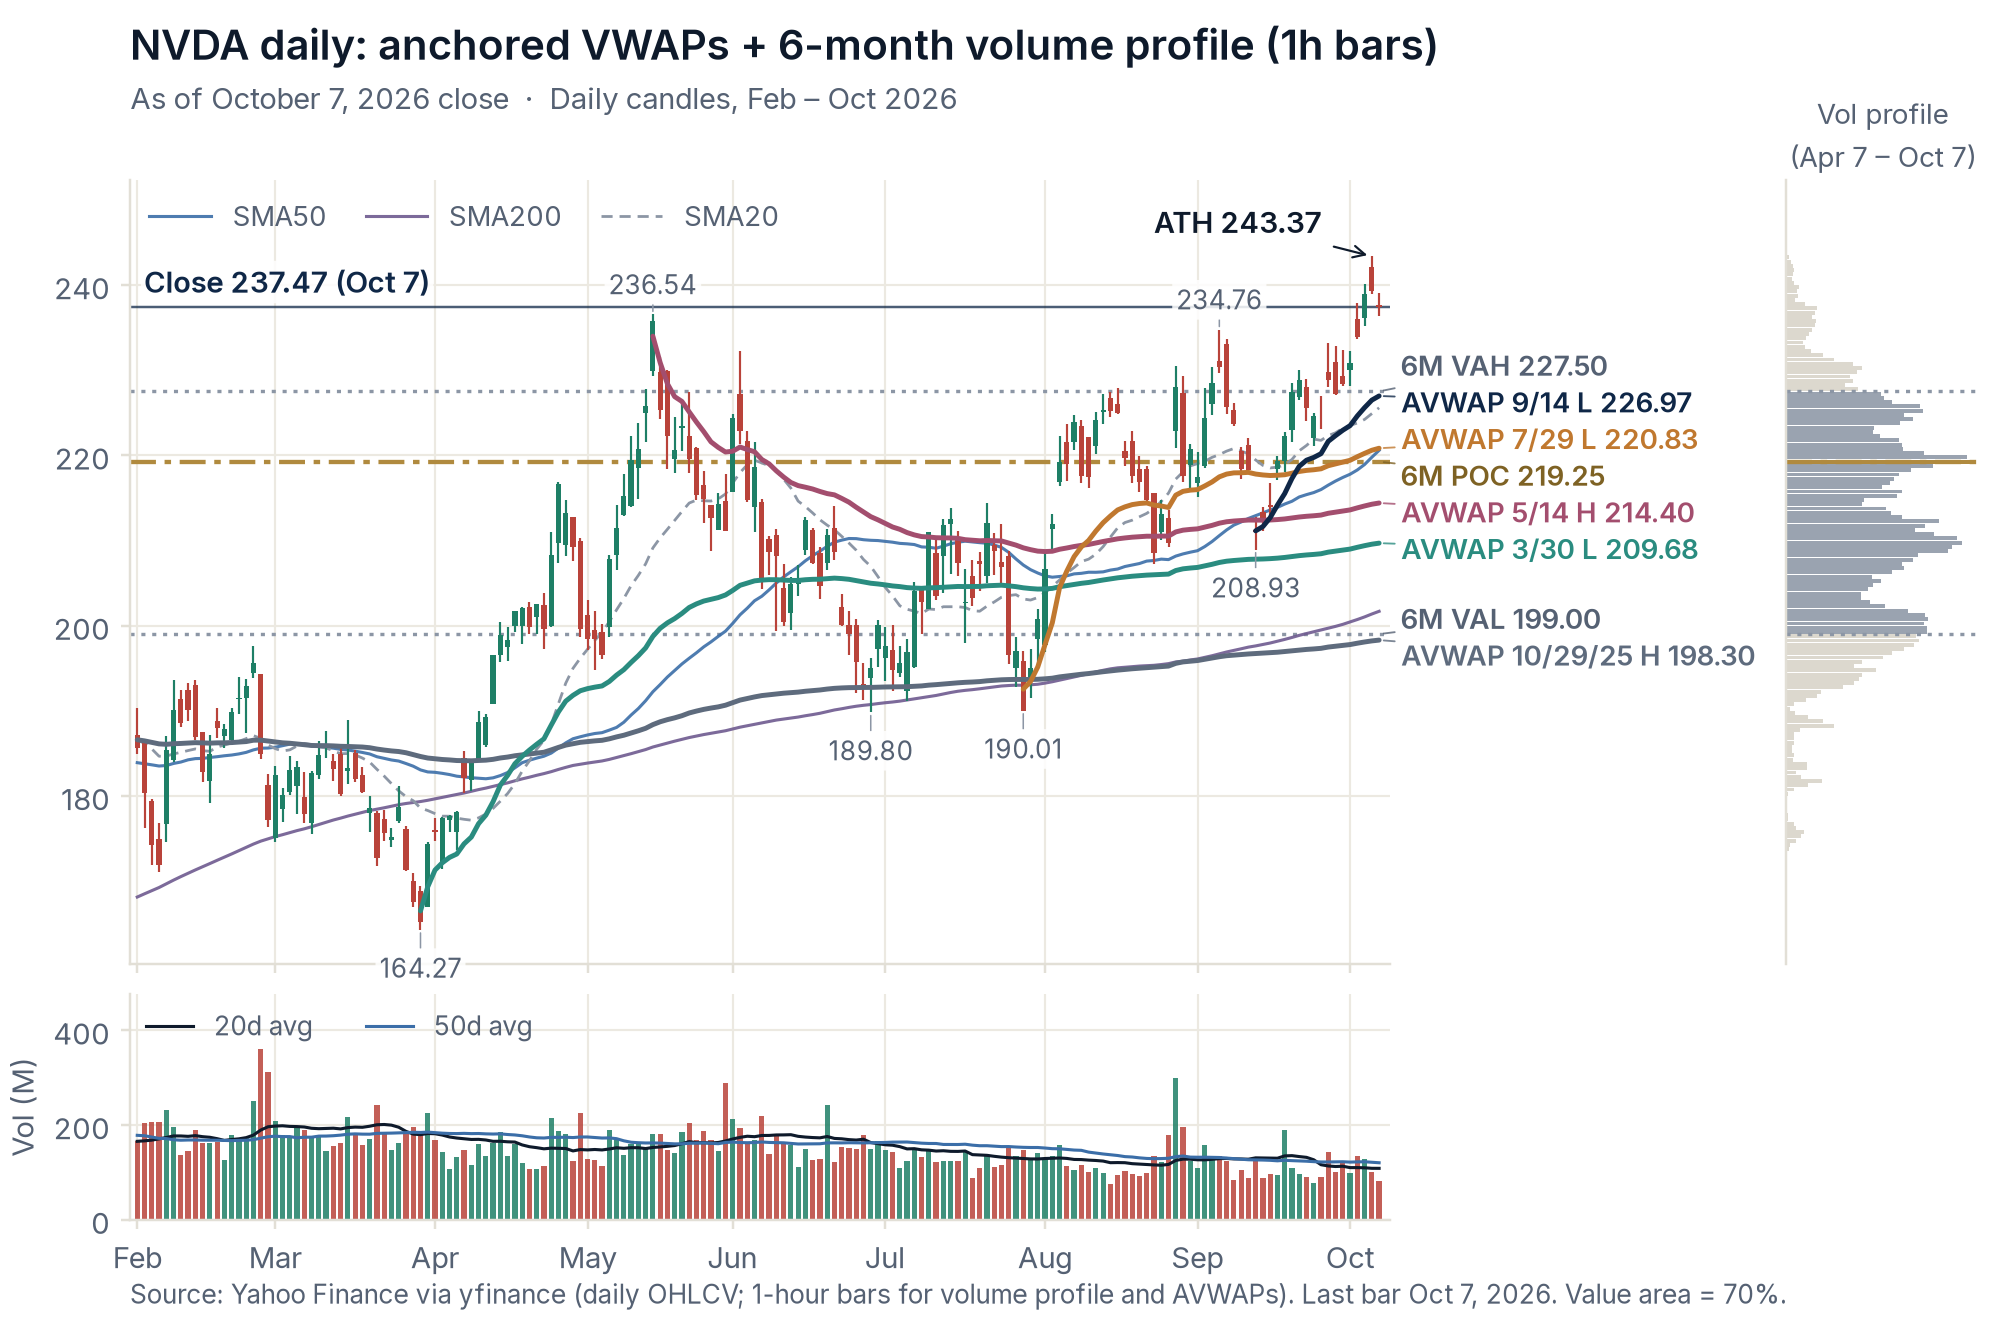
Daily chart with moving averages, swing-anchored VWAPs and the six-month volume profile (value area and point of control).
As of October 7, 2026 closeFull size ↗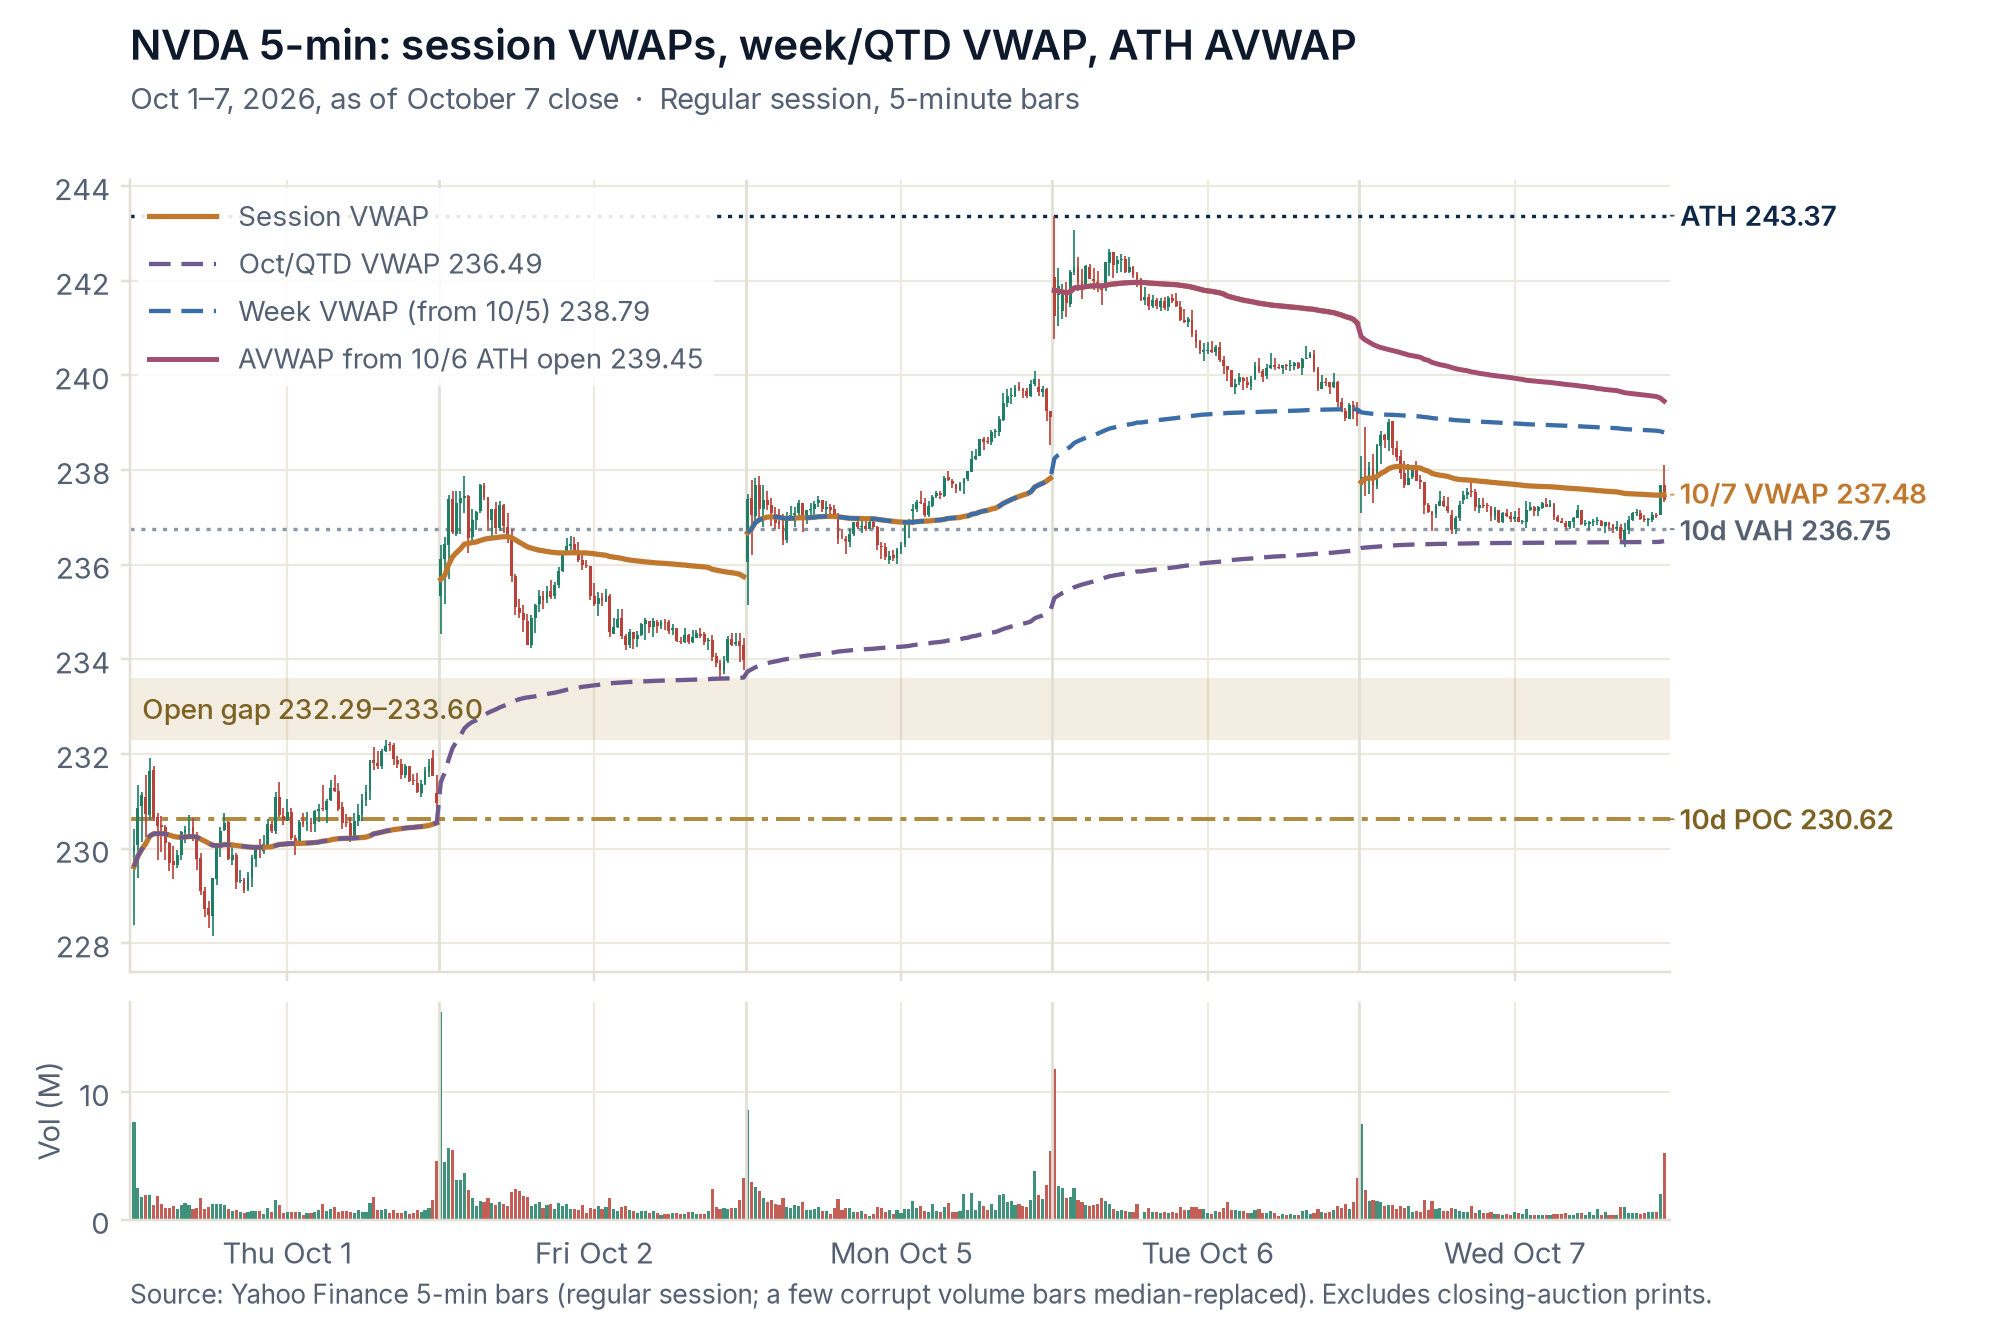
Session, weekly and quarter-to-date VWAPs, the VWAP anchored at the all-time high, and the open gap.
As of October 7, 2026 closeFull size ↗