Screener
Finds what's broken.
Ranks each day's top gainers as short candidates using dilution, toxic financing, NAV premium and pump-and-dump history, scored from public filings.
SUNY Brockport · BS Finance
Finance student building an AI-assisted equity research desk.
I direct a small AI research team: four analysts that screen, value, time and size every idea. I make the final decisions; the team does the reading, the math and the checking.
Built on free, public data. Every call is dated and kept.
About
I'm Brad Wolff, a BS Finance student at SUNY Brockport. I'm a member of the university investment club and take the student-managed fund course, where students manage a real-money portfolio.
In that course I help run a portfolio of about $150K that regularly beats its benchmark.
Alongside that, I direct a small team of AI research assistants. Each has one job: Screener looks for what's broken, Graham works out what a business is worth, Wick reads price and volume for timing, and Ledger sizes positions and produces the reports. Together they produced a 34-page initiation report on NVIDIA, technical studies, a short-side screener, and the tools we use to track trading.
This site is the public side of that work: dated, with the reasoning shown, and clearly labeled as an educational project.
Process
One stock, four questions, three possible calls.
Brad Wolff directs a small AI research team: four analysts, each with one job. Brad makes the final decisions; the team does the reading, the math and the checking.
One stock, four questions. Every idea goes through the same steps in the same order.
Three possible calls. The answer is always one of three: buy (a good business at a price with room for error), wait (a good business, but the price already assumes too much), or steer clear (something is broken, at any price).
Margin of safety. We buy only when the price sits well below our estimate of value, because estimates are often wrong. The less predictable the business, the bigger the cushion we require.
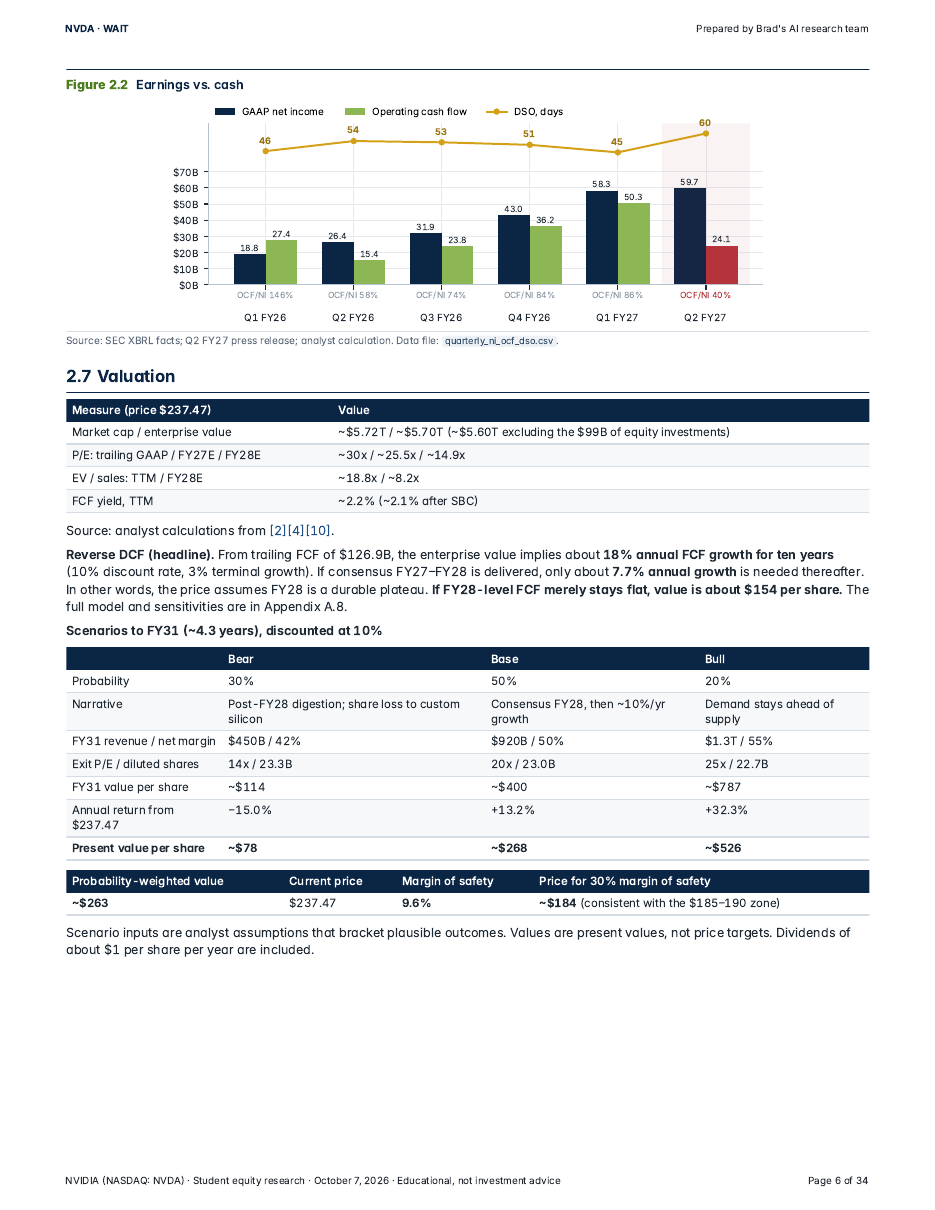
Worked example: NVIDIA, as of the October 7, 2026 close. We valued the shares at about $263, a probability-weighted average of a bear, a base and a bull case. At $237.47, that left a margin of safety of only 9.6%. NVIDIA is an outstanding business, but its earnings are cyclical and its cash flow had just fallen well behind its profits, so we wanted 30%. That points to about $184. The call was wait, with a buying zone of $185–190 and a list of what would change our minds.
What we don't do. We don't chase price targets, hype a setup, or call a trade a success just because it made money. A good process with a bad outcome still counts as a good process, and the reverse doesn't count at all.
Educational project, not investment advice.
By Graham, the desk's fundamental analyst. Worked example as of October 7, 2026 close.

The desk
Screener finds what's broken, Graham decides what it's worth, Wick says when, and Ledger sizes it.
Finds what's broken.
Ranks each day's top gainers as short candidates using dilution, toxic financing, NAV premium and pump-and-dump history, scored from public filings.
Decides what it's worth.
Values the business from its record, its current health and a range of scenarios, then makes the call: Buy, Wait or Steer clear.
Says when.
Reads price through volume. Anchored VWAPs and volume profiles set the entry zone and the level that would prove the idea wrong.
Sizes it.
Sizes positions so no single mistake can do serious damage, tracks trading performance and produces the final reports.
Featured research
The desk's first full report: 34 pages covering valuation, technicals, risk and an illustrative sizing plan.
An excellent business at a fair, not cheap, price. Wait for the $185–190 shelf or a clean fiscal Q3 2027.
Highlights
Pages from the report, Wick's charts and Ledger's tools. Select any exhibit to enlarge it or open it full size.
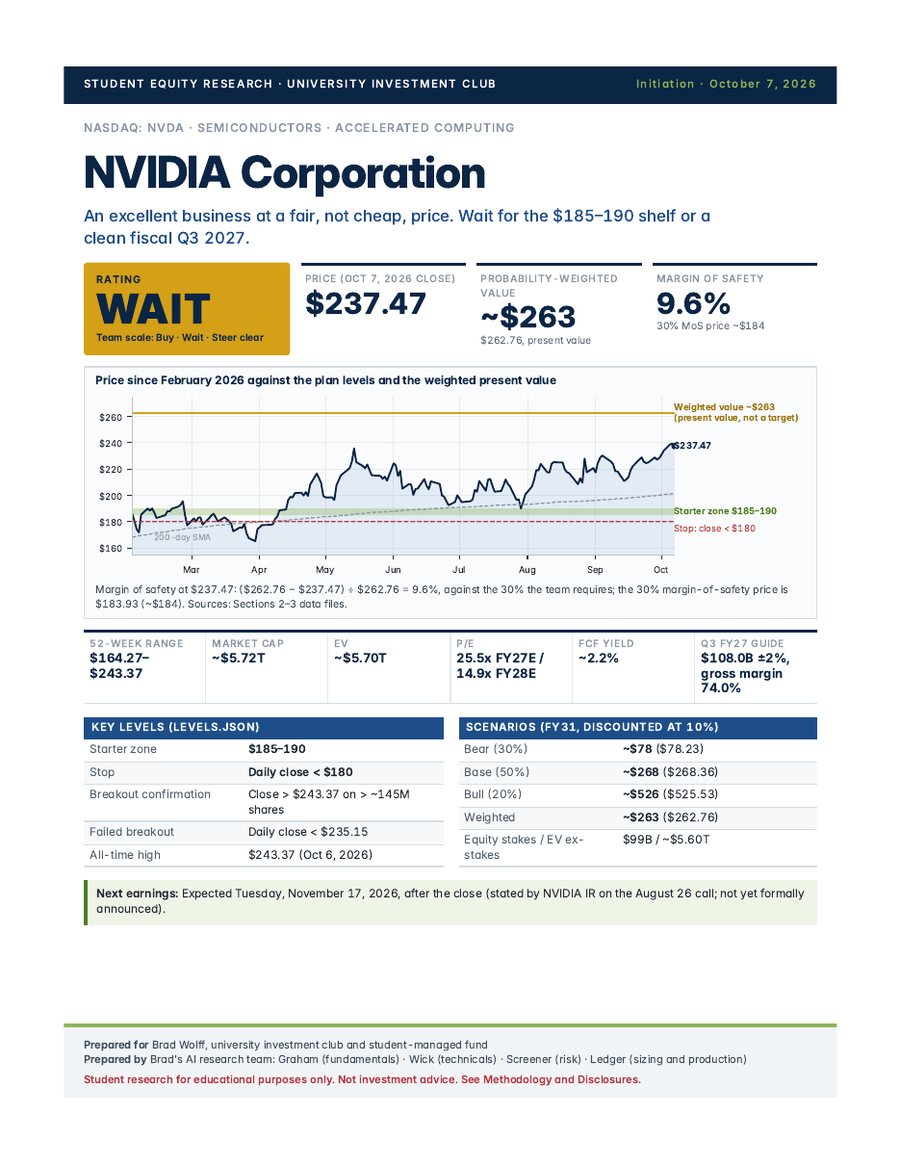
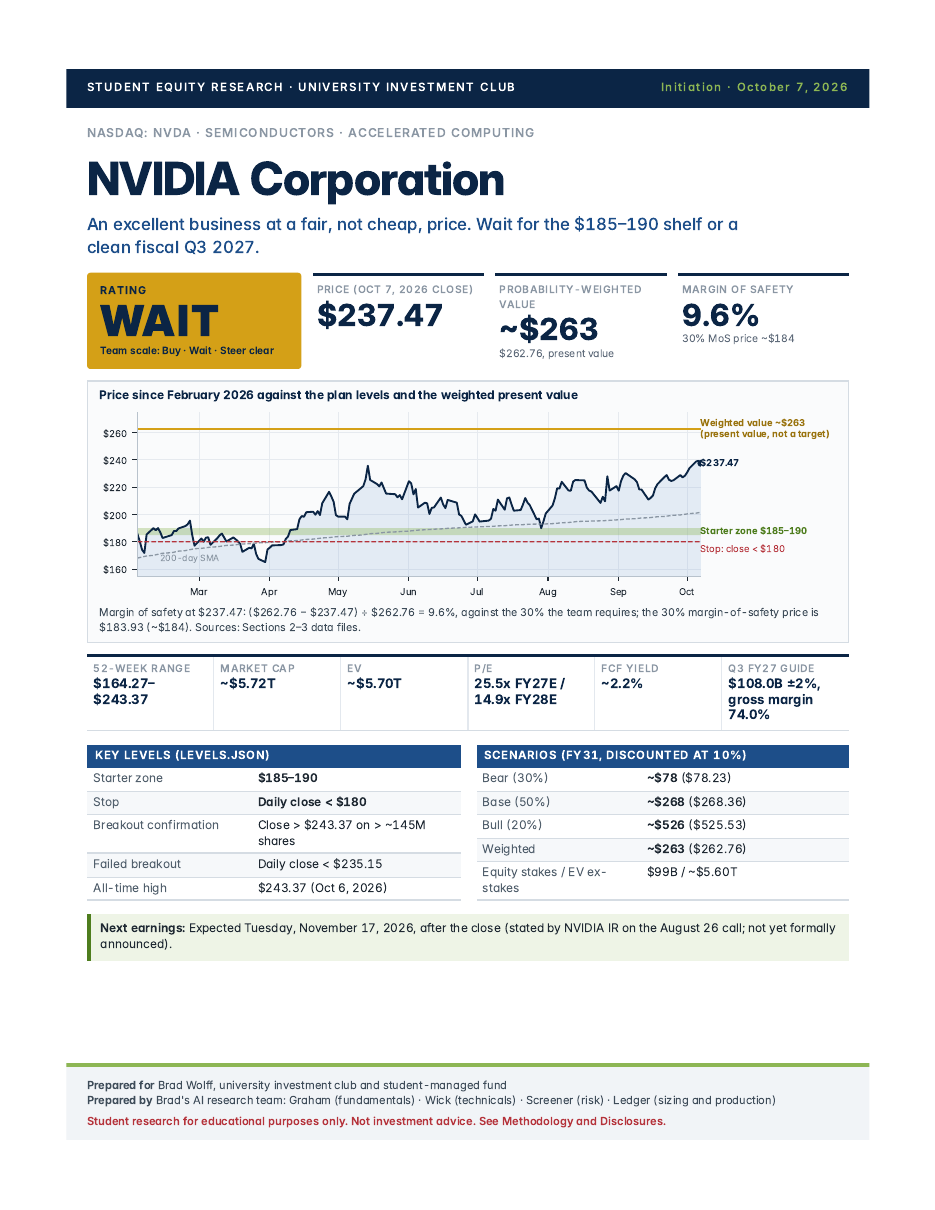
Page 1: the WAIT rating, $237.47 price against a ~$263 probability-weighted value, and the key levels.
As of October 7, 2026 closeFull size ↗
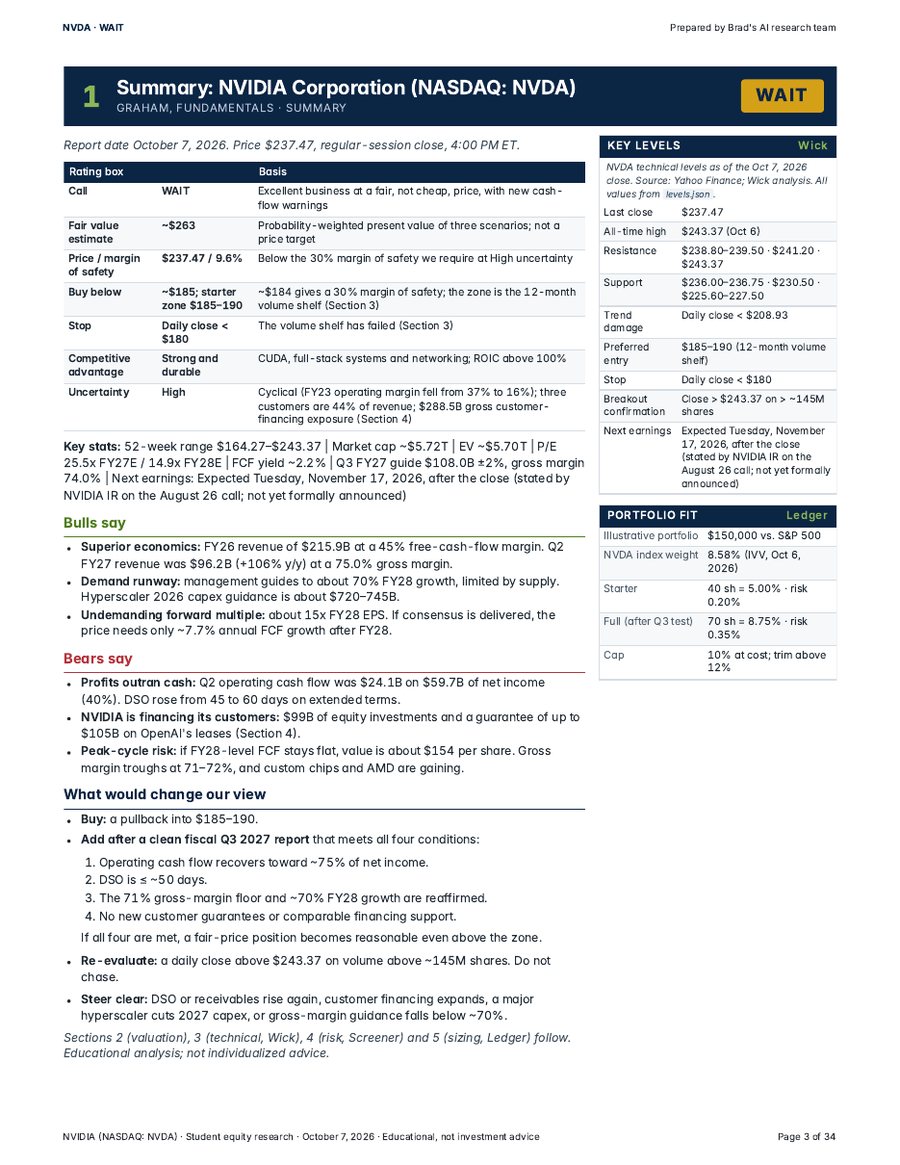
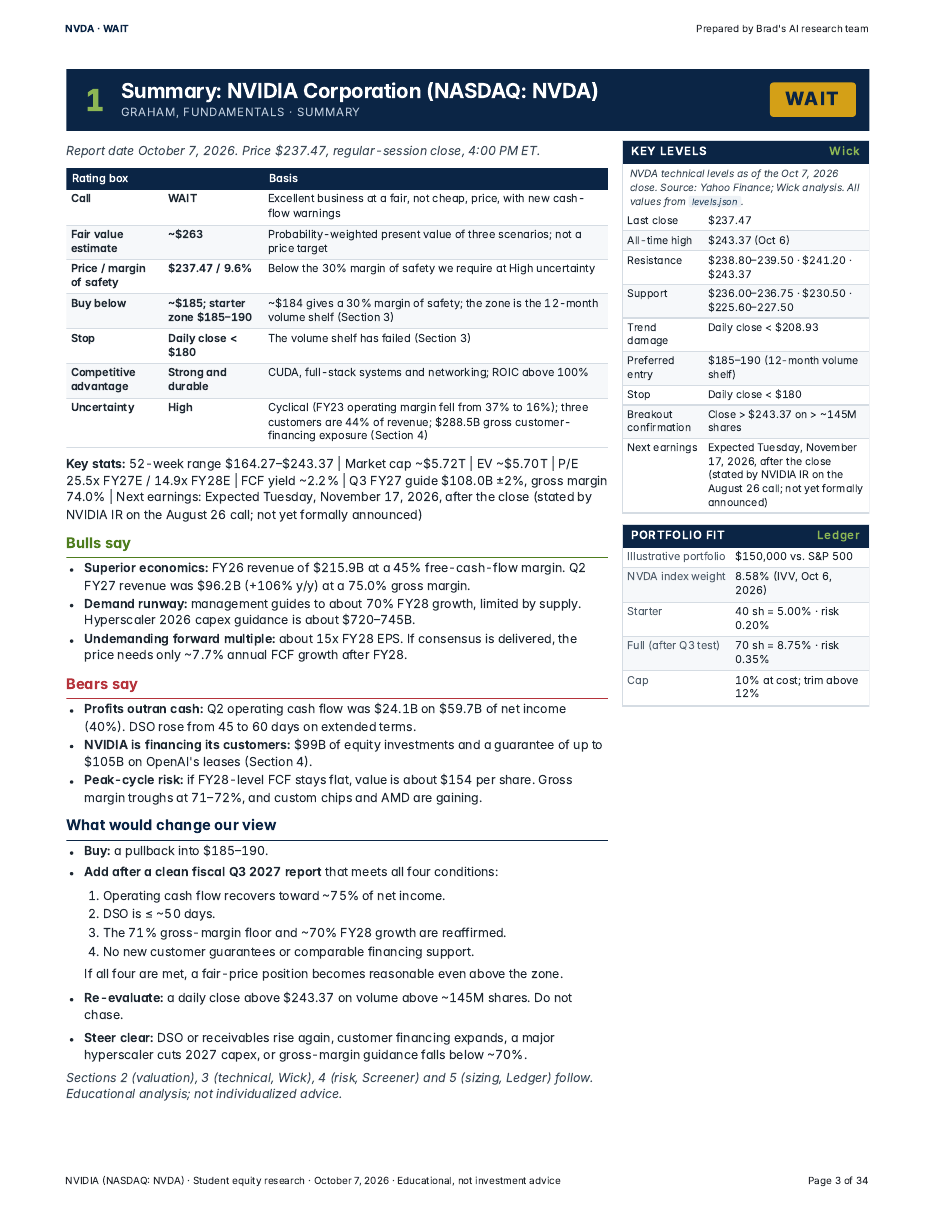
The whole call on one page: rating box, Bulls say / Bears say, and what would change the view.
As of October 7, 2026 closeFull size ↗
Net income vs. operating cash flow, and the bear / base / bull scenarios behind the margin-of-safety math.
As of October 7, 2026 closeFull size ↗
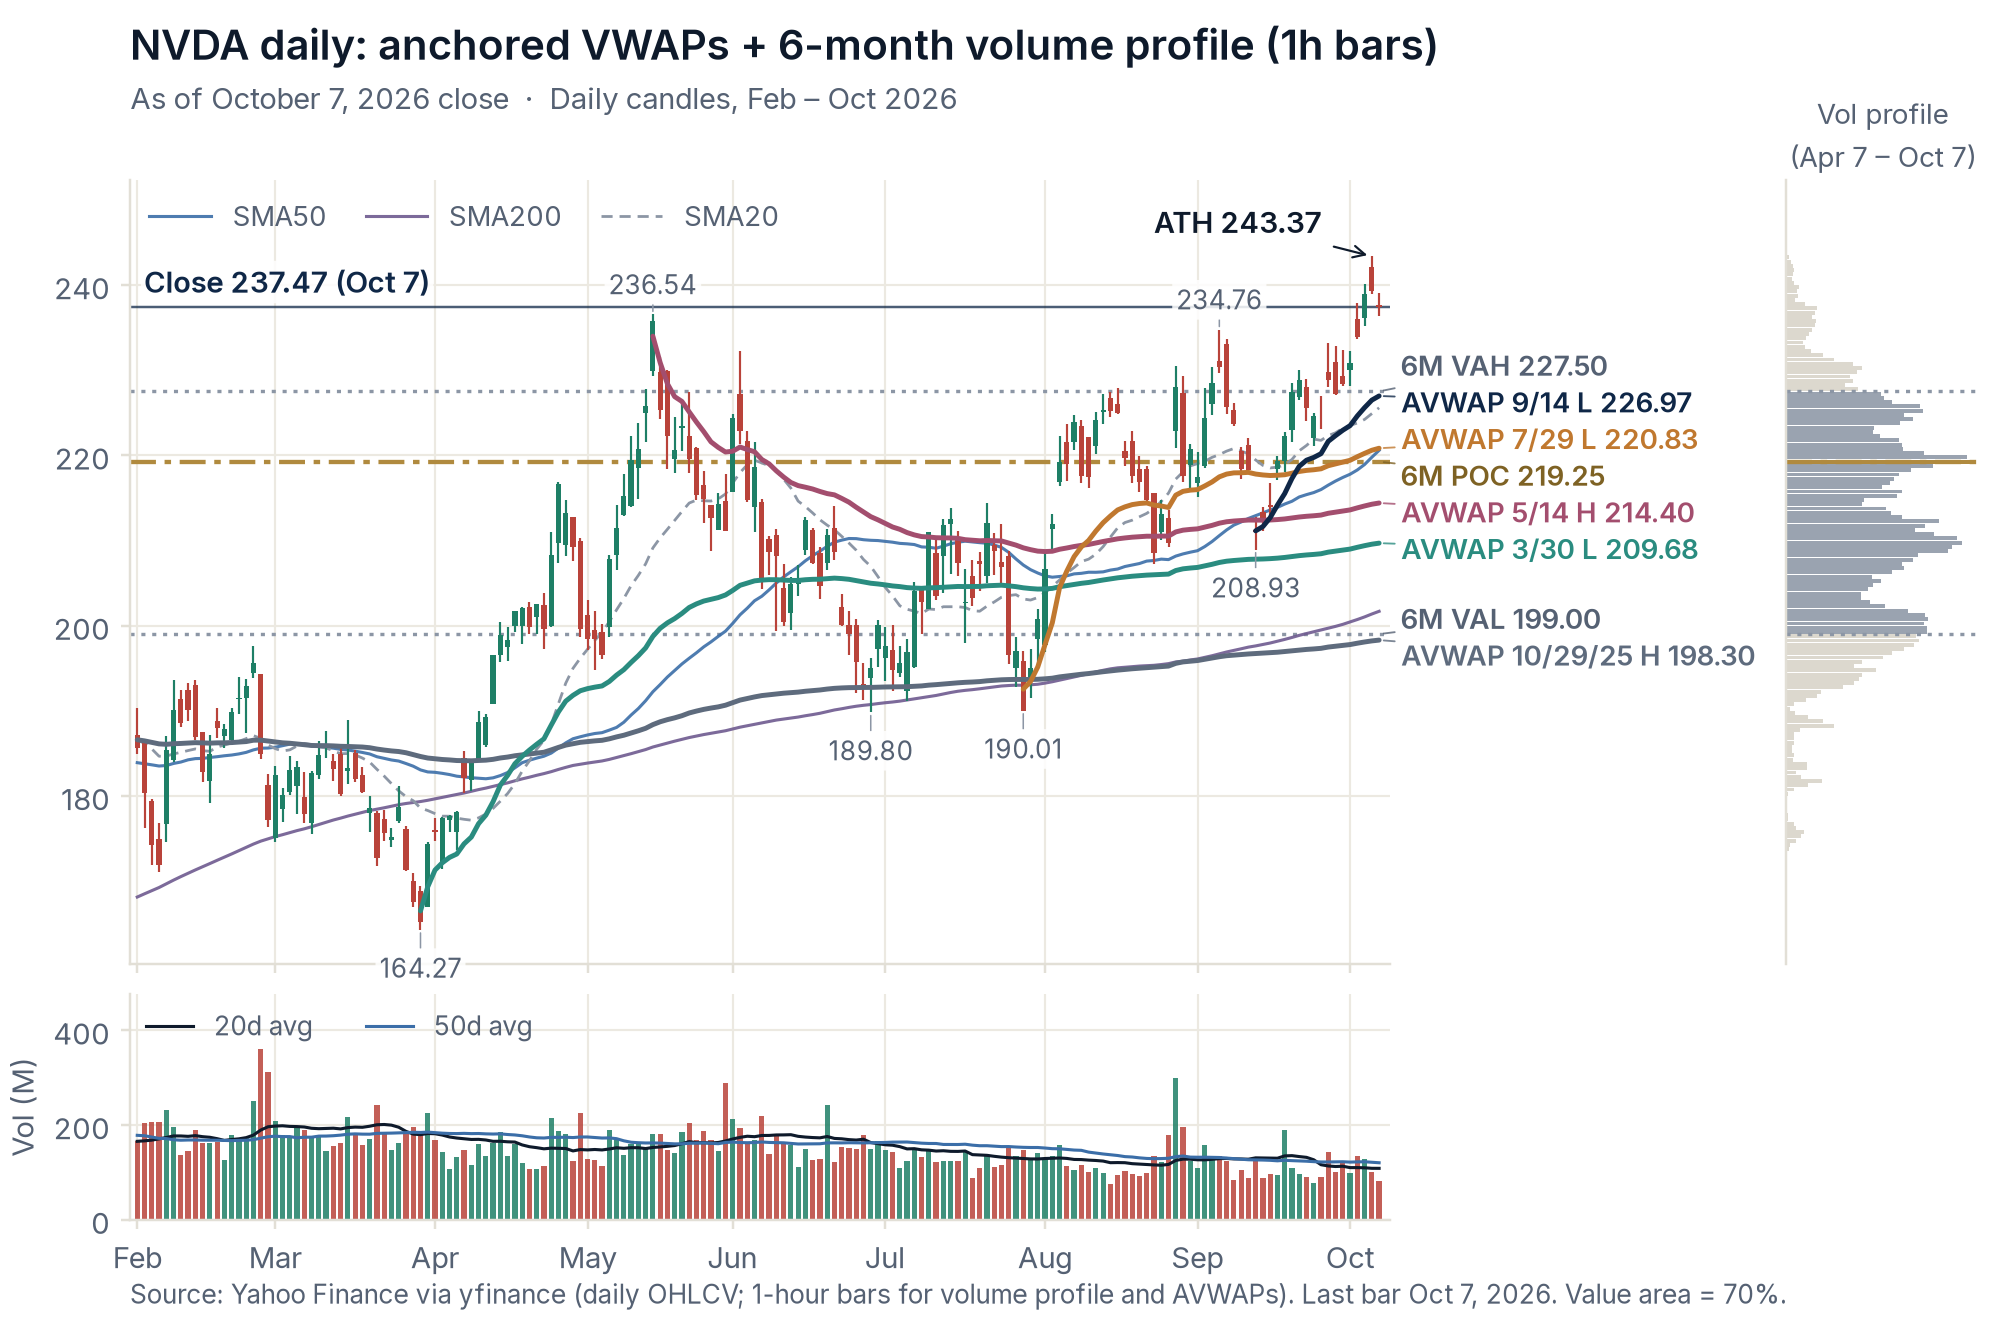
Daily chart with moving averages, swing-anchored VWAPs and the six-month volume profile (value area and point of control).
As of October 7, 2026 closeFull size ↗
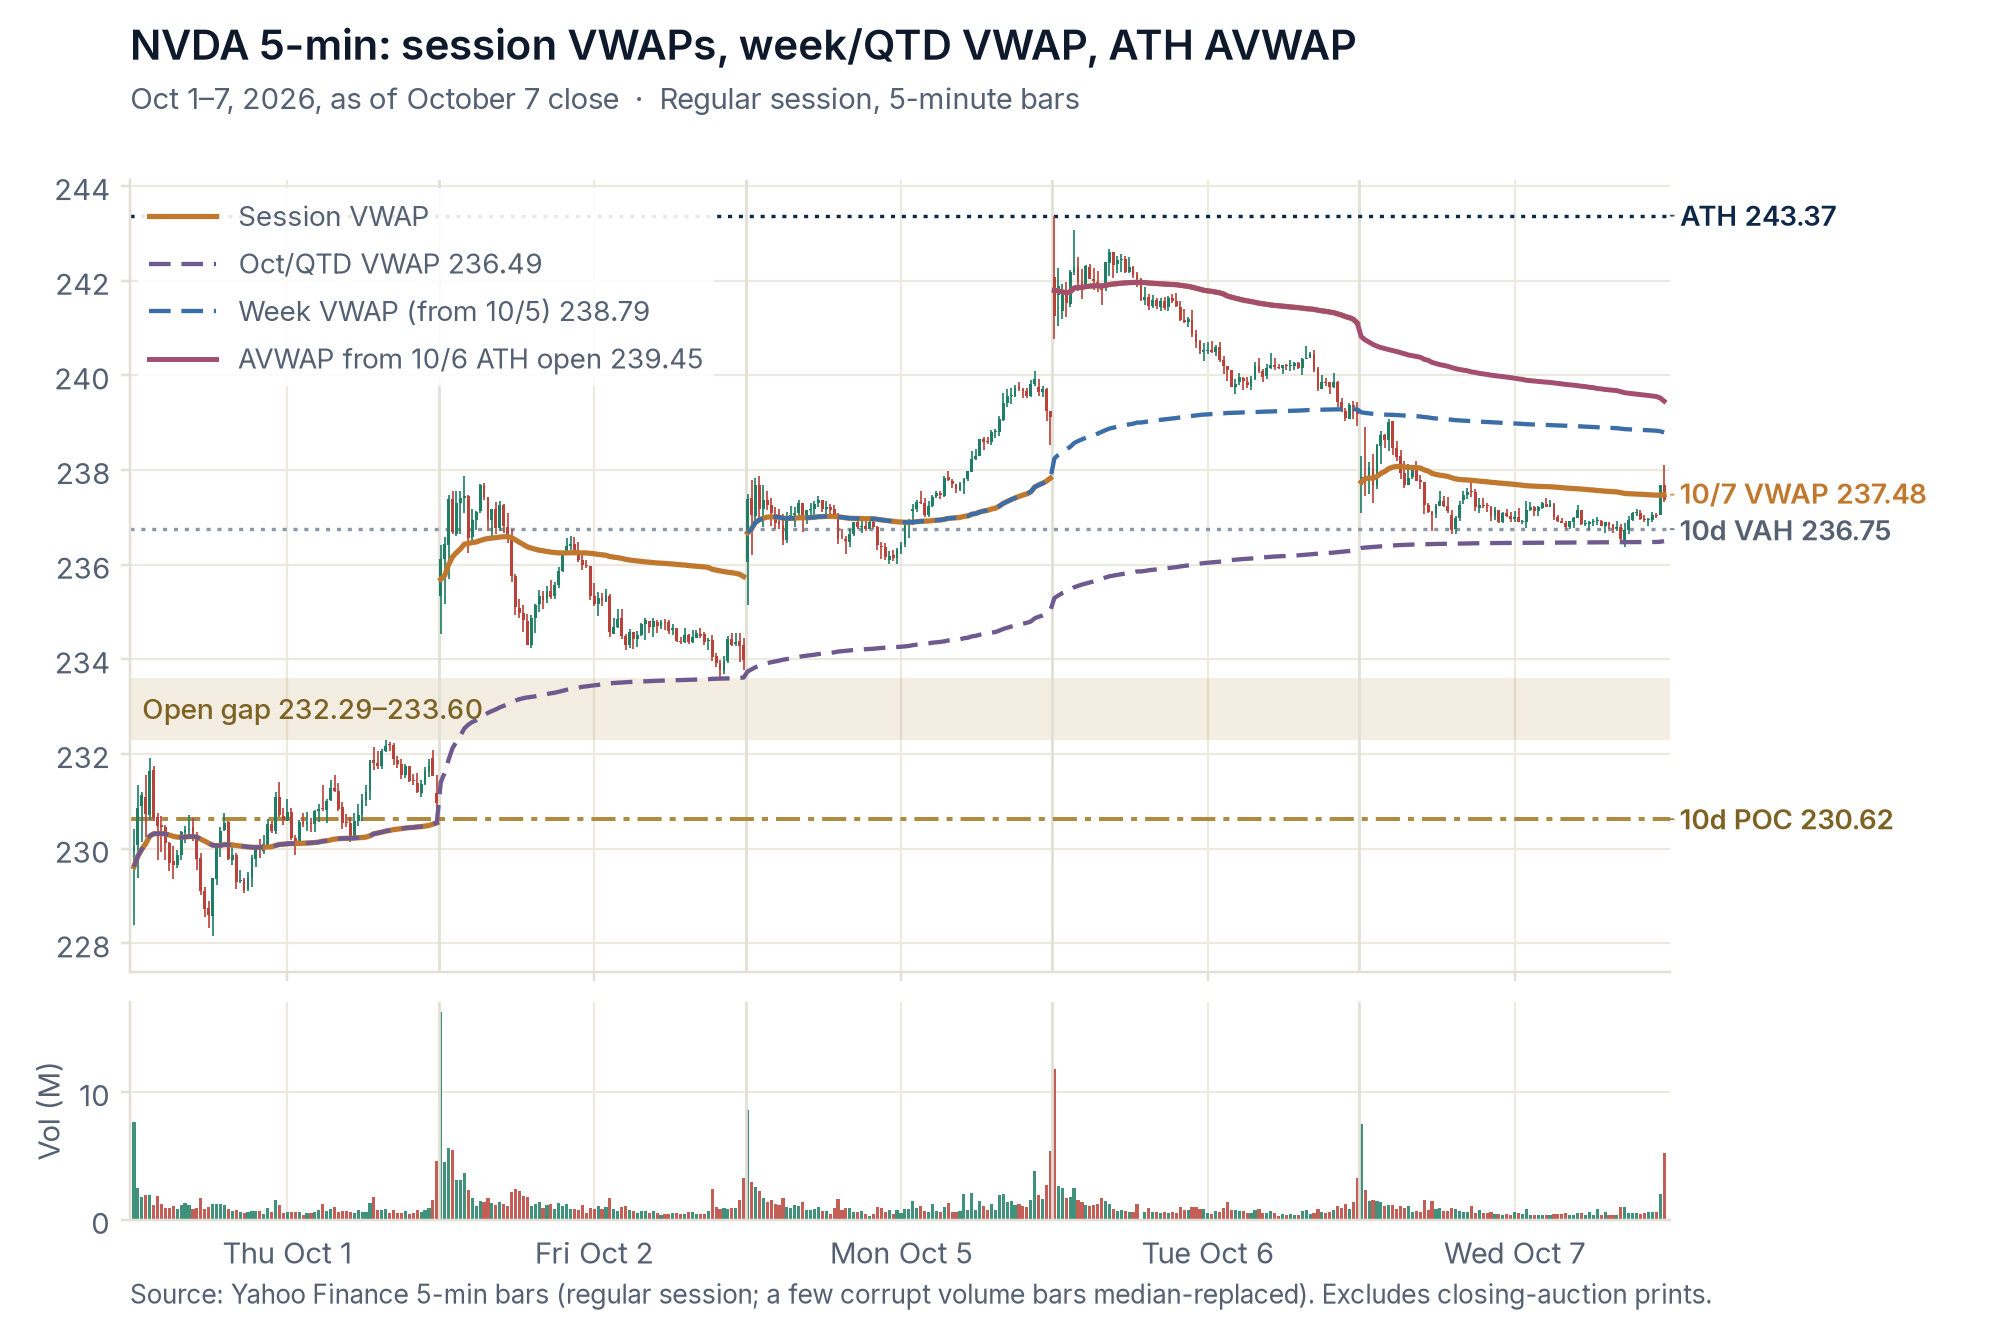
Session, weekly and quarter-to-date VWAPs, the VWAP anchored at the all-time high, and the open gap.
As of October 7, 2026 closeFull size ↗
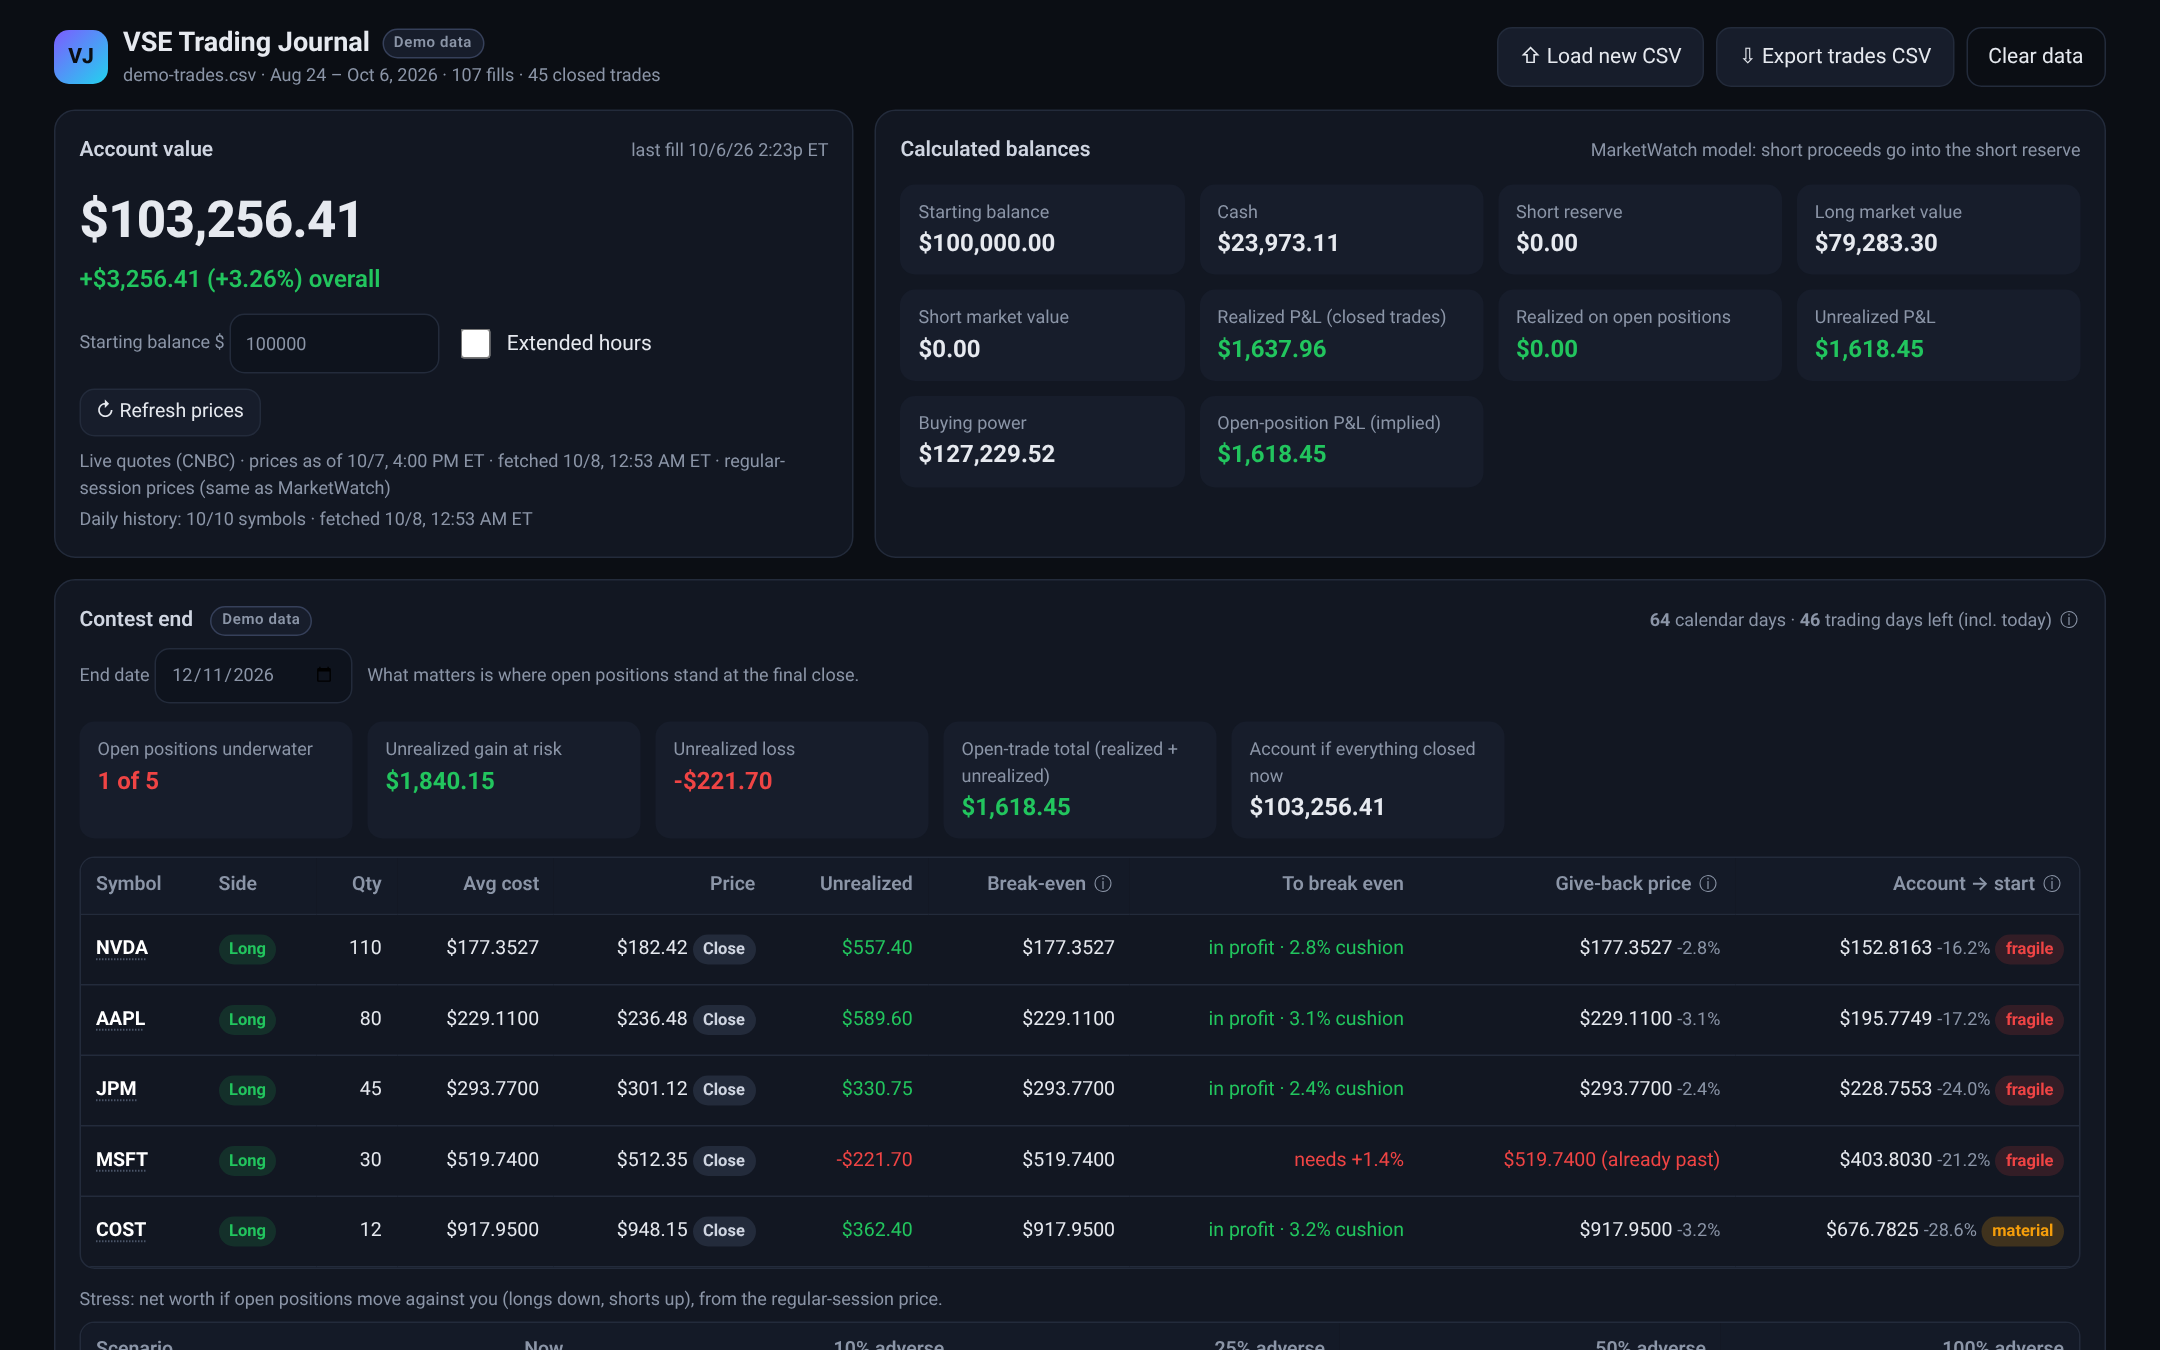
Account value, calculated balances and the contest-end view, rebuilt from every fill. Demo account starting at $100,000; prices and figures are illustrative demo data.
Illustrative demo dataFull size ↗
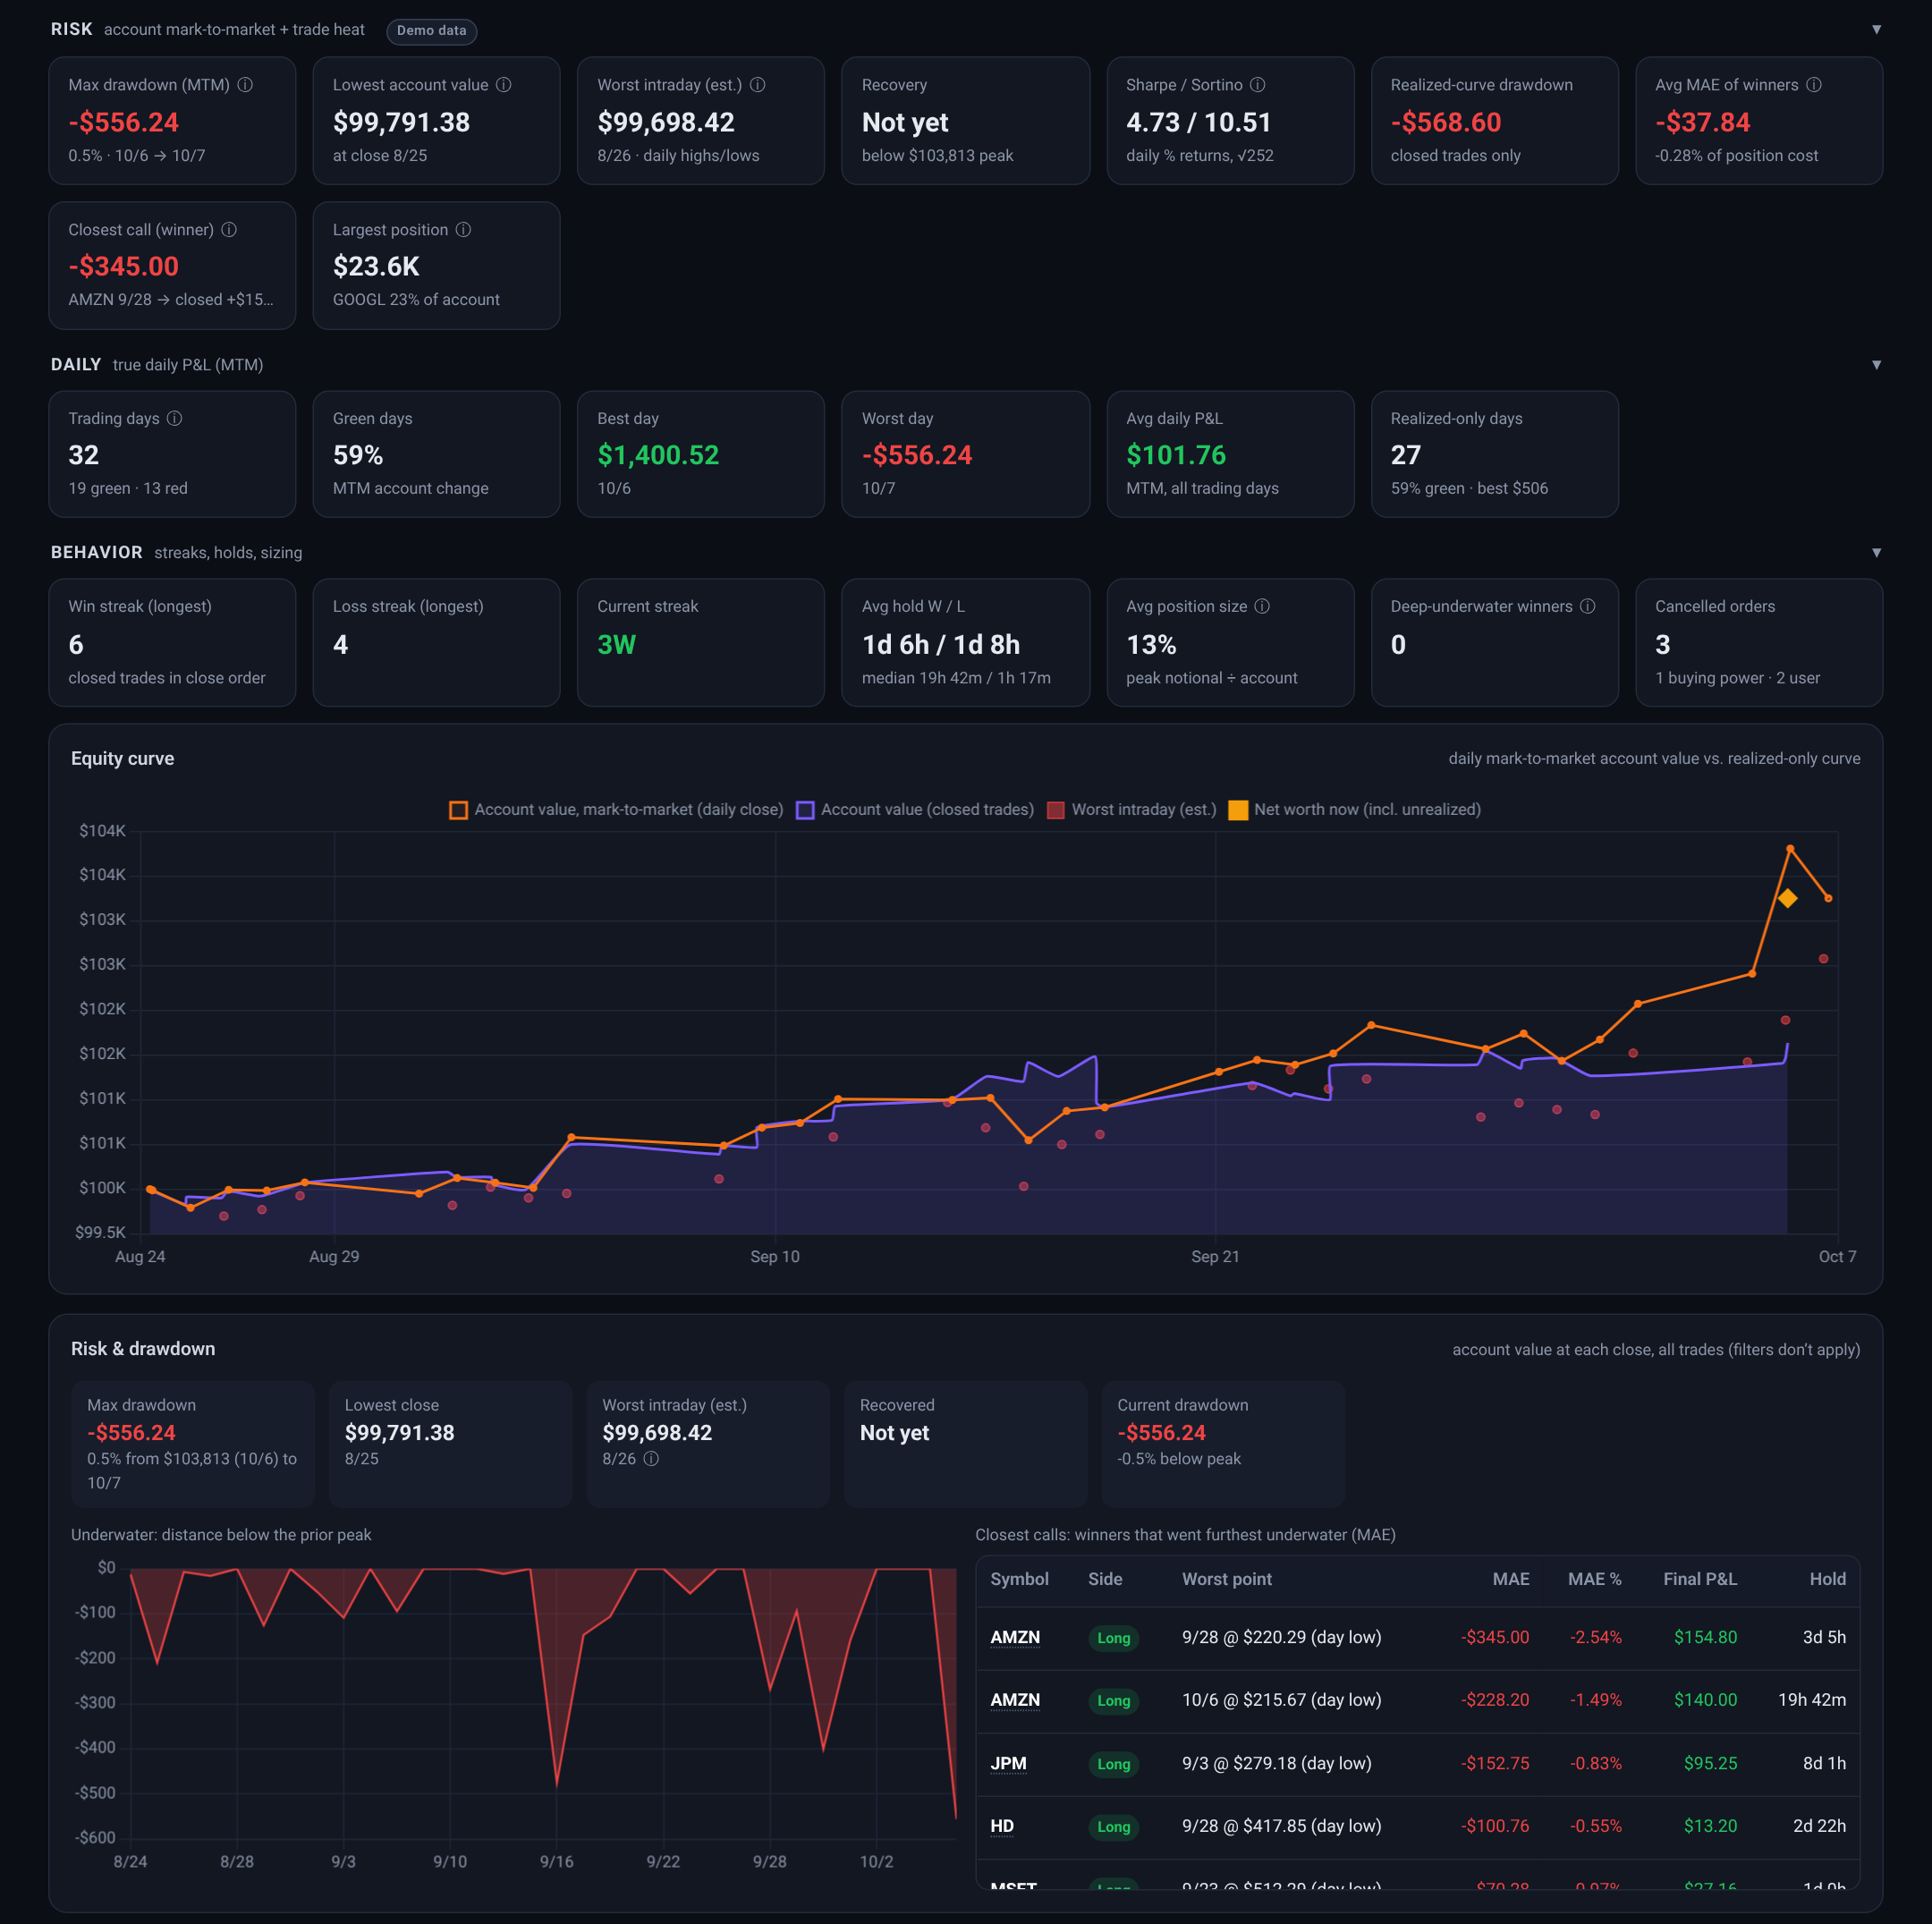
Drawdowns, daily P&L, streaks and the equity curve, so the process gets judged, not just the result. Demo account starting at $100,000; figures are illustrative demo data.
Illustrative demo dataFull size ↗
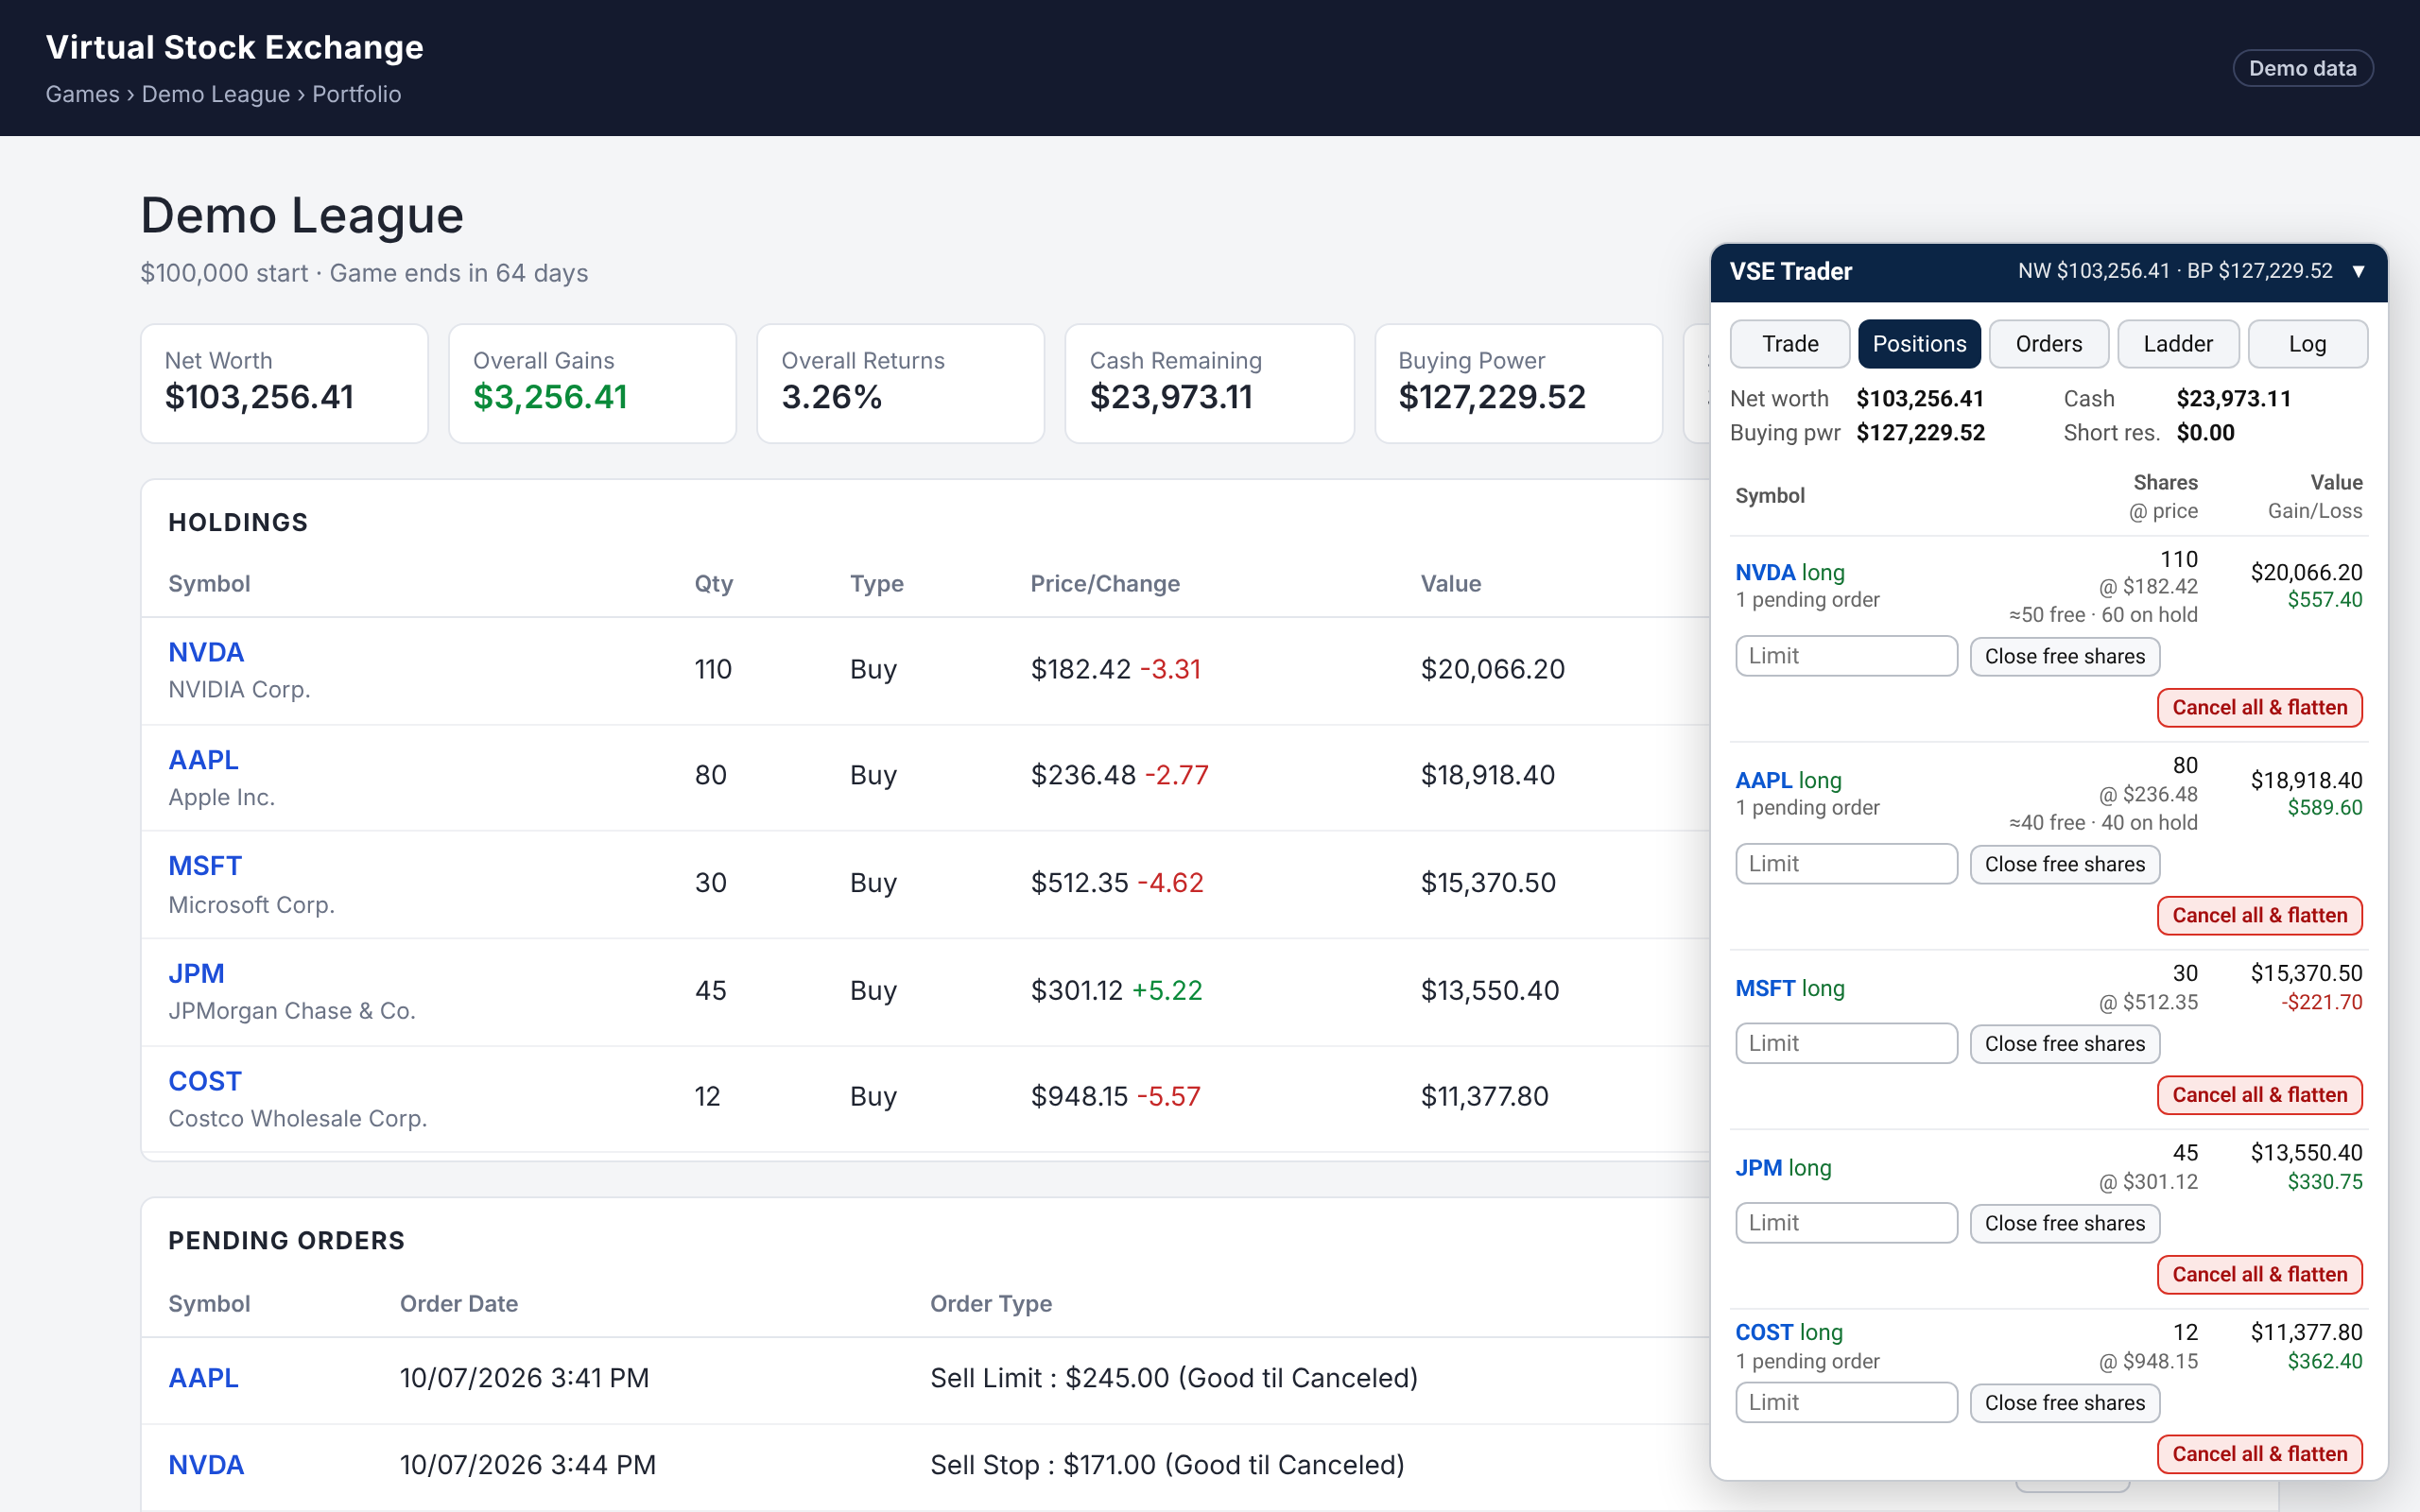
Docked beside the game's portfolio page: net worth, buying power, per-position exits and pending orders. Demo account starting at $100,000; figures are illustrative demo data.
Illustrative demo dataFull size ↗
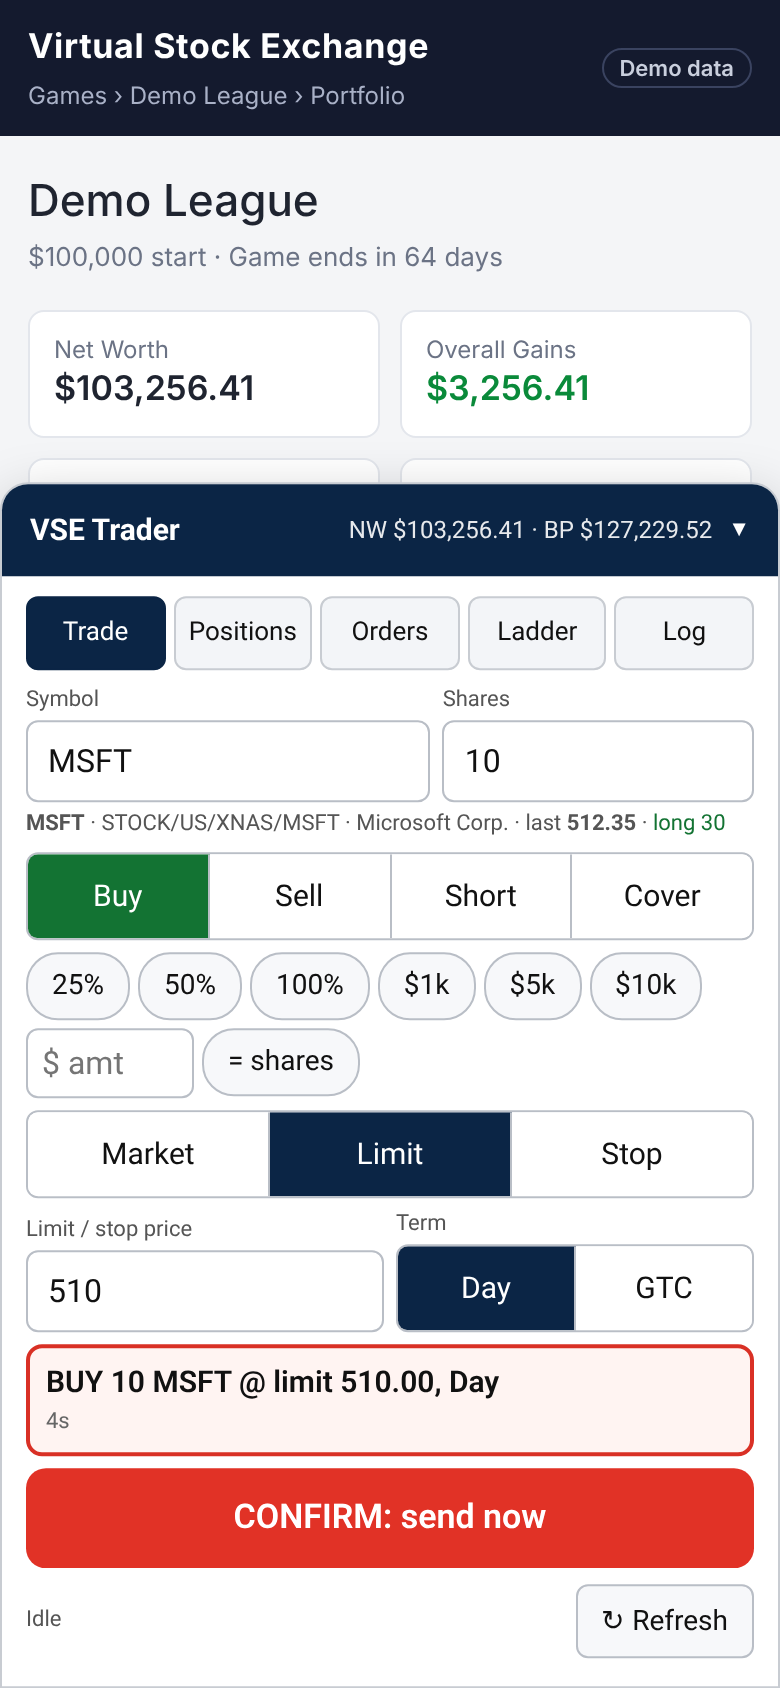
Every order takes two taps: arm it, then confirm within 5 seconds. Demo account starting at $100,000; figures are illustrative demo data.
Illustrative demo dataFull size ↗Selected work
A 34-page initiation on NVIDIA. Rating: WAIT. At $237.47 the shares trade 9.6% below the desk's $262.76 probability-weighted value, short of the 30% margin of safety the team requires. Covers valuation, technical levels, risks and an illustrative position-sizing plan.
As of October 7, 2026 closeView → Technical analysisWick's charts behind the report's levels: daily candles with 20/50/200-day averages, VWAPs anchored at major swings, a six-month volume profile, and a 5-minute intraday view of Oct 1-7.
As of October 7, 2026 closeView → Forensic screeningHow Screener ranks each day's biggest gainers as short candidates: impending dilution, toxic financing, share-count growth, reverse splits, NAV premium and pump-and-dump history, all scored from public SEC filings.
Methodology as of October 2026View → ToolingLedger's trading journal for the MarketWatch Virtual Stock Exchange game. It rebuilds account value, P&L, drawdowns and contest-end stress tests from raw fills. Shown here with a fictional demo account starting at $100,000; all figures are illustrative demo data, not Brad's account.
Illustrative demo dataView → ToolingA trading command center that docks on the Virtual Stock Exchange game page: positions, buying power, one-tap exits and two-step order entry (arm, then confirm). Shown on a mock page with a fictional demo account starting at $100,000.
Illustrative demo dataView → Public folderAn index of every public file on this site (15 items): reports, charts, write-ups and demo screenshots, each with its as-of date.
Updated with each releaseBrowse →Contact
I'm happy to talk markets, research process, or the tools behind the desk.